Alex Stewart and MarkStats look at the last two seasons of Premier League goalkeeper passing data to analyse which keepers add attacking value or open their sides up to risk
Ideas for articles can come from all kinds of places. In this instance, we put out a call on Twitter some time ago for things people would like to see written about, and by far the stickiest response came in the form of a meme, courtesy of Andrew Stobie (thank you, Andrew).
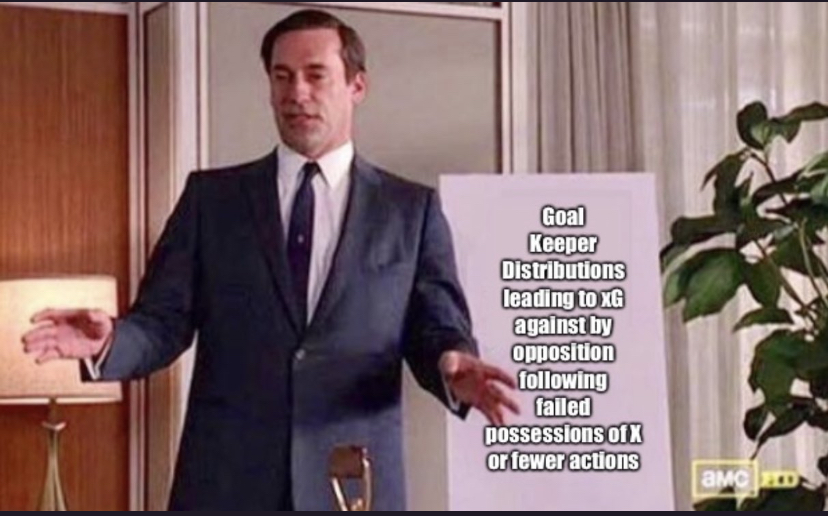
Of course, while the function of the Don Draper Life Cereal Pitch Parodies meme is to suggest an idea that is idiotic or unworkable, this one is far from dumb.
In fact, with goalkeeper distribution an inherent element of how teams play, assessing the risk/reward approach of keepers has significant value.
With this in mind, we used a number of criteria to assess how goalkeepers pass and what kind of opportunities their teams can derive from this, and what kind of opportunities can be opened up for the opposition instead.
Using Premier League goalkeeping data from this season and last, we assessed pass length and retention rate, expected goals for and against, and expected threat for against (see the note at the end of the article on how this was done).
It’s worth noting that the counter of actions reset each time a goalkeeper touched the ball. So a chain of GK to CB, CB to FB, FB to GK, GK to CB, and then ball lost, is two sets of chains counting three possessions, then one possession.
Style and Retention
The first thing to assess is style and retention. Style, in this sense, means long or short on average. There’s a semantic point to be made here about style, because most data providers/analysts now look at a number of different metrics that tend to indicate ‘playstyle’ At Analytics FC, for example, we talk about ‘full control’, ‘direct domination’, and so on – you can find a more comprehensive explanation here.
Clearly, the passing approach of a team’s goalkeeper is integral to this. A team playing a ‘deep build-up’ style cannot have a goalkeeper who yeets it past the halfway line every time. As team styles have become more refined, sophisticated, and coached (and, over a longer time period, as rules around the back pass and more recently goal kick length have altered goalkeeping distribution), goalkeeping distribution approaches are a fundamental cornerstone, indeed, a good indicator, of team playstyle.
Some teams want to build from the back. As Jamie Scott has written on this site, for positional teams this involves the goalkeeper acting like a deeper defensive midfielder, with similar passing angles, efforts at circulation, and offering as a passing reception option. Jamie also points out that:
“The keeper and the #6 are used in a similar fashion to solve many tactical situations. One of the hallmarks of strong in-possession teams is their ability to play passes in short distances in each phase. The structure around the ball remains largely compact, in order to minimise the distance for each pass, thus, minimising the risk of losing possession.”
And as you can see from the three visuals below, there is a clear negative correlation between pass length and pass retention, as would be expected. The visuals, considering retention after three, five, and 10 actions show remarkably little difference. Ball retention drops as the number of actions increases (Ederson goes from around 67% to 54% to around 30%, although obvious this doesn’t mean Ederson himself, but Manchester City).
One can infer two things from this: that teams who focus on a build-up style originating with their goalkeepers making short passes are consistently better at retaining possession overall; and that teams with goalkeepers who pass long are less focussed on retaining possession, or less good at it. This could be stylistic – some teams do want to create counterpressing opportunities, for example, or lack the defenders to play out from the back – or it could be a lack of passing competence at the back hampering efforts to implement a playstyle. Figuring out which would require a more holistic assessment of the teams in question (which we will do a bit later on) but, for example, it’s no surprise to see direct teams like Burnley, counterpressing teams like Southampton, and poor teams like Watford, feature among the long pass, low retention set. It’s also no surprise that teams like Manchester City make an active effort to recruit goalkeepers who are good at passing.

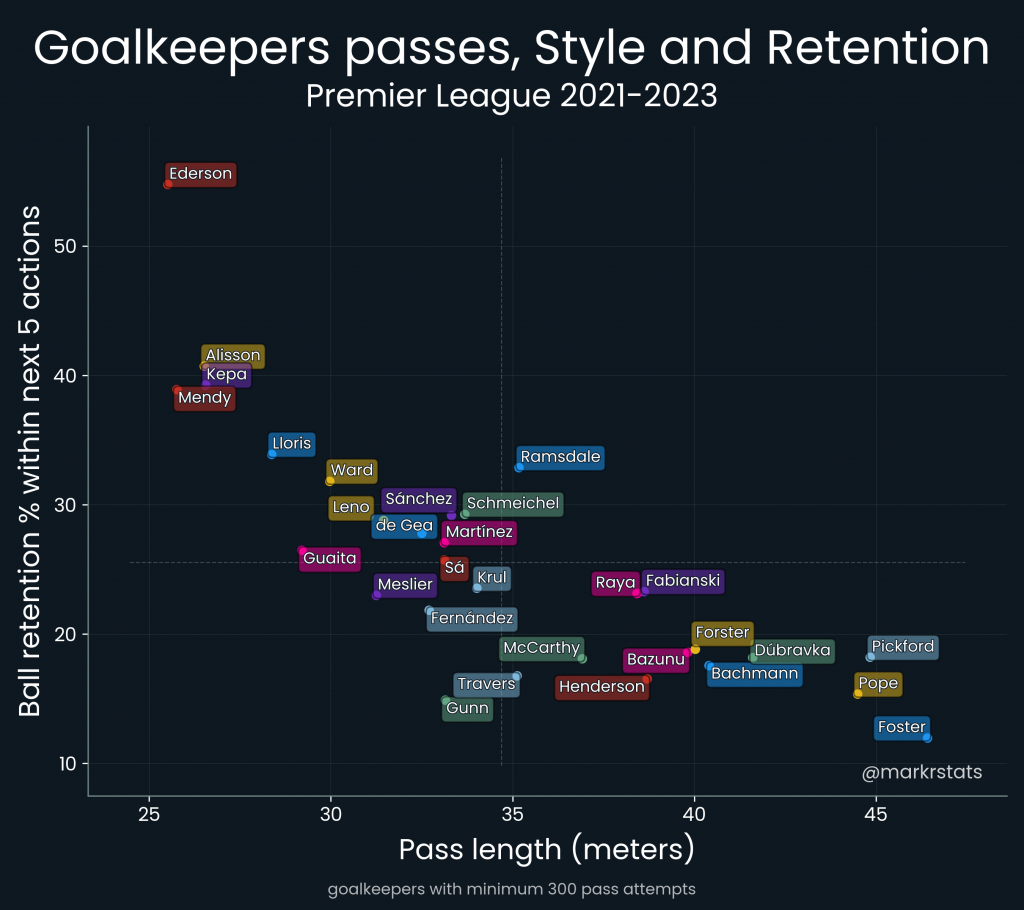
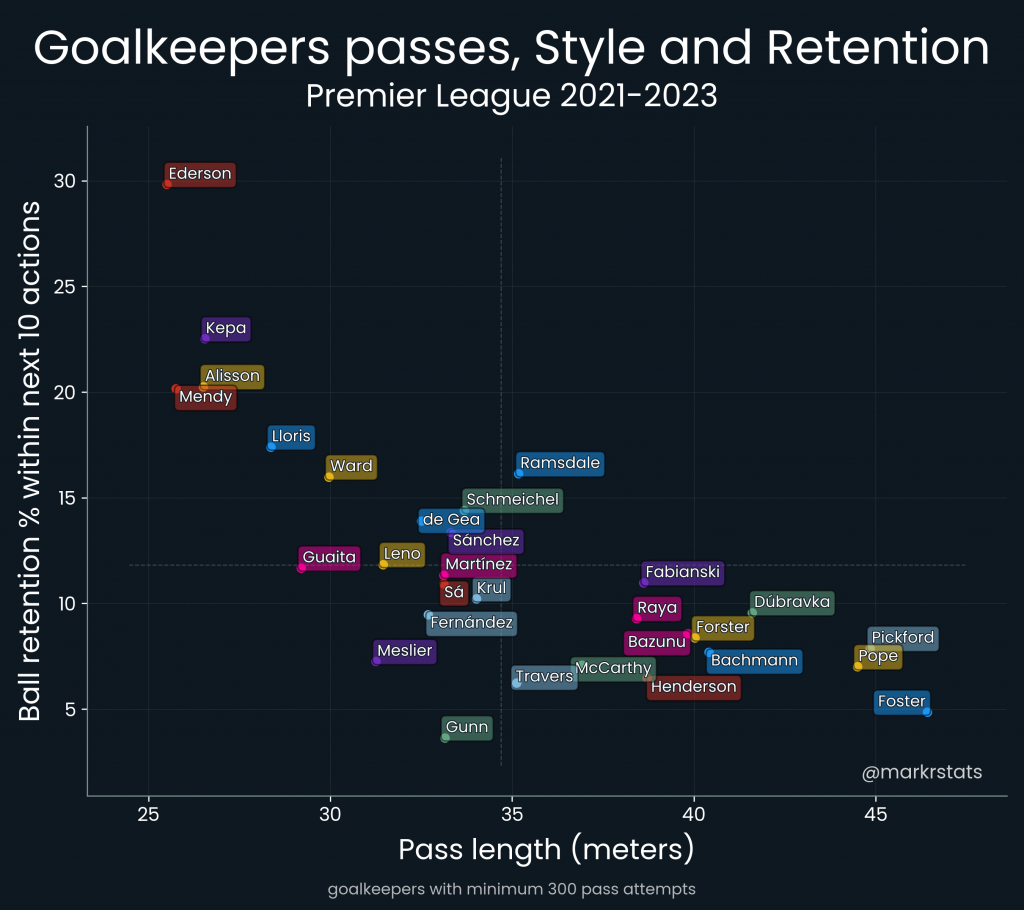
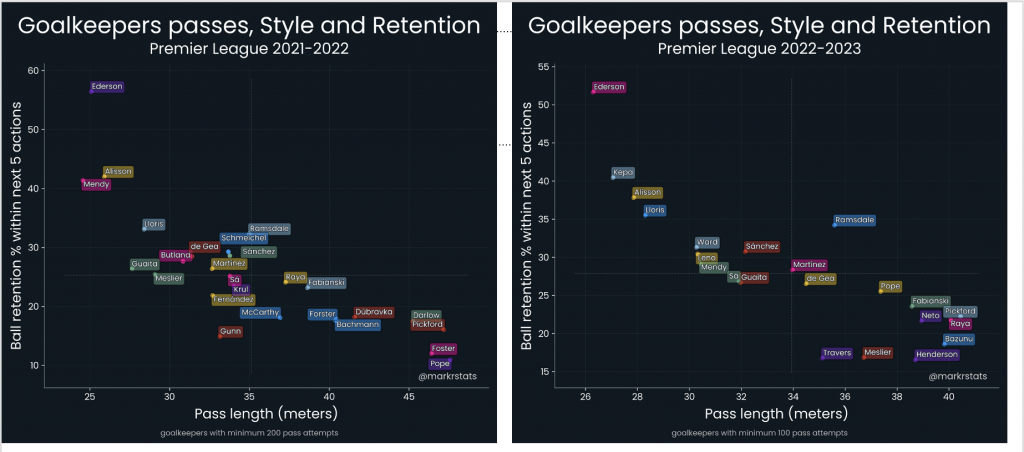
It’s worth saying that Nick Pope’s passing has shortened considerably from 2021/22 to this season, dropping nearly 10m on average; these graphs show the average across the two seasons but Pope’s data, extracted and compared across his time at Burnley and Newcastle, show a keeper whose style has evolved as his team has changed. The two graphs below, showing length and retention after three passes, compare the two seasons. Interestingly, Raya has gone the other way, playing more directly, while the overall trend is towards shorter passing, with far fewer keepers averaging over 40m pass length.
It’s also interesting that Ederson remains consistent, but both Alisson, and the Chelsea keepers Mendy (2021/22) and Kepa (2022/23) are both passing longer and less accurately than last season.
Expected goals for and against
Next, let’s look at expected goals for and against. This section has been included as a nod to the original suggestion but it’s worth saying that xG is not the most effective way of assessing this, as shots that close to goalkeeping distribution, especially where N<3, are infrequent.
By looking at xG and xGA per 100 touches, we can reward ‘keepers whose teams do not play with such a focus on possession, but do achieve or, indeed, give up, expected goals. Ederson, again, leads the way with the most xG within the next five actions and the fewest xG conceded. Hugo Lloris does well in creation, probably due a few longer ball forwards to Kane or Son which yield shots fairly quickly.

Daniel Bachmann (Watford) and Danny Ward (Leicester City) yield the most xGA, although probably for different reasons: Leicester try to play out but get turned over close to goal, while Watford’s more direct style was not backed by high retention, so the ball came back at them fairly rapidly.
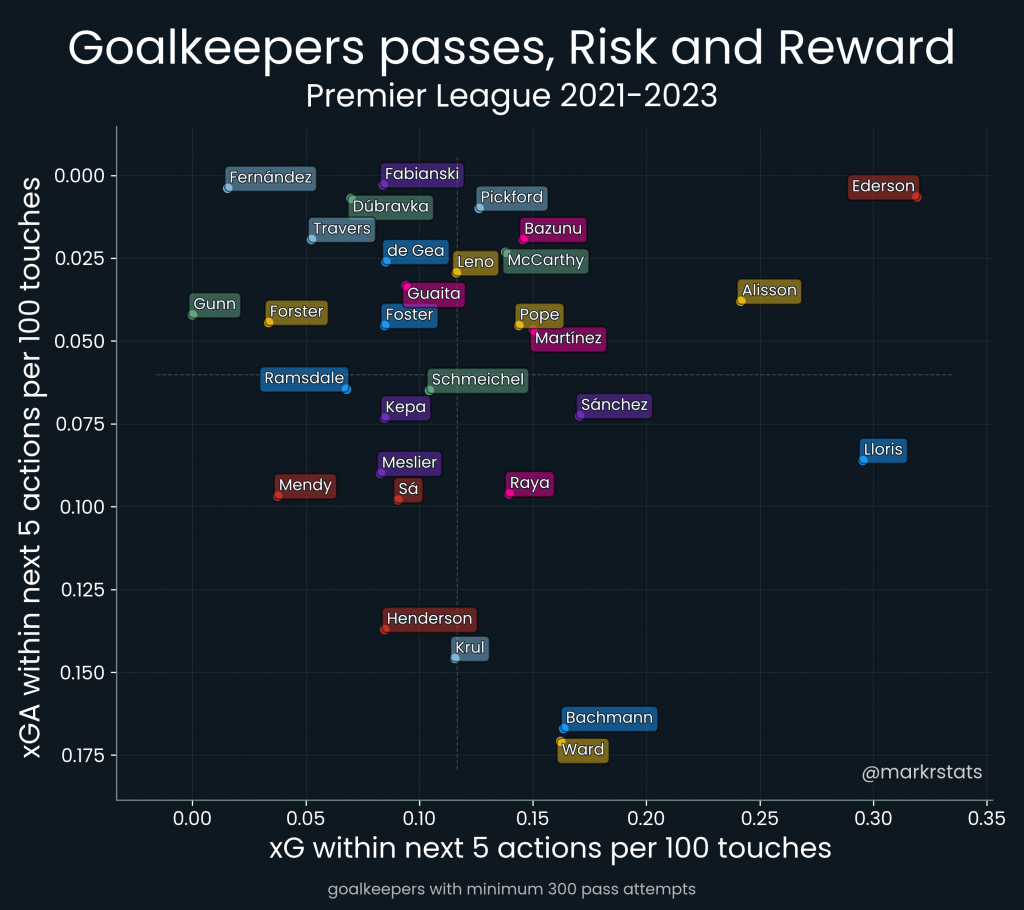
It’s clear, though, that requiring xG or xGA to occur within, say, five actions means that shots have to happen more frequently than they ordinarily would for us to infer anything that useful. So let’s instead look at xT.
Expected threat for and against
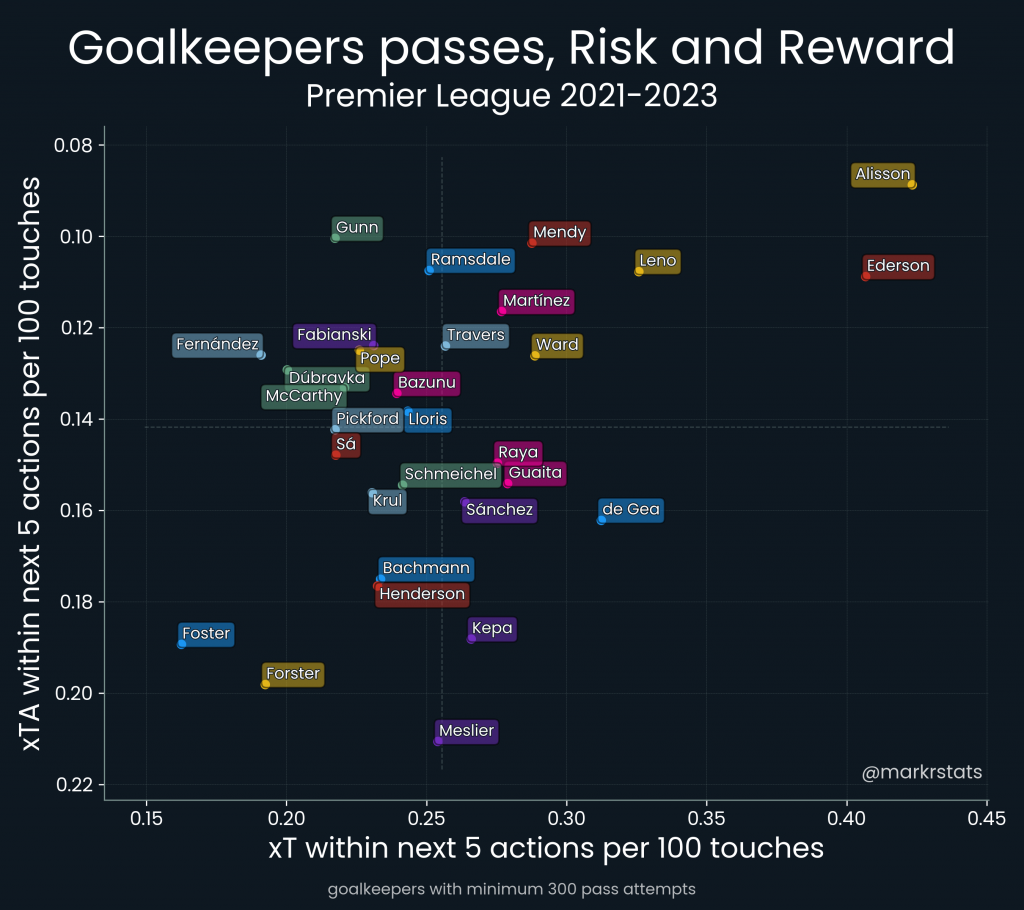
Expected threat is a more all-round measure of a team’s ability to build opportunities to score and it provides a better measure of goalkeeping risk and reward than xG, due to the relative infrequency of shots. Once again, there is a bias towards keepers from ‘good teams’, with Ederson and Allison far ahead of everyone in terms of “xT risk/reward per 100 touches.” If we look again within five actions, we can see this clearly. We can also see that, for example, Lloris offers a bit less in the way of xT than he did xG, while Danny Ward looks more secure – this again suggests the slightly weird skew of factoring shots in versus general threat. Southampton’s Angus Gunn does very well for xTA, but offers little in threat generation, showing how Ralph Hasenhuttl’s team sometimes built quite patiently rather than being as direct as some from the back (perhaps a reflection of Gunn’s kicking skillset as compared to, for example, Fraser Forster’s). Edouard Mendy, Aaron Ramsdale, and Bernd Leno are the best of the rest, with a good balance of limited xTA and reasonable to good levels of xT created.
Again, we can break the above numbers into two seasons’ worth, which shows a few interesting things. Alisson’s threat has increased significantly, which as shown above, has coincided with him passing longer more on average. Alisson’s xG per 100 touches within the next five actions has also increased, so it’s likely that some of this increased threat at least is that Liverpool’s increasing directness is yielding more for the goalkeeper in terms of measurable creativity.
Ederson is creating markedly less xT this season compared with last, while Martinez has improved from last season in both measures, and Ramsdale is giving up more but creating more. Leno again shows up well, suggesting that Arsenal were on the right track securing him as a ball-playing keeper, and he’s now able to show this once more at Fulham. There seems across the two seasons to be a level beyond which most ‘keepers don’t fall in terms of giving up threat, but Illan Meslier, Neto, and Kepa have all seen significant xTA and that should prompt their teams to change their build-up approach.

If we now look briefly again at style, we can see a few interesting things. Let’s consider the following keepers, from the 2021/22 season: Nick Pope (Burnley), Ederson (Manchester City), Illan Meslier (Leeds United), and Fraser Forster (Southampton).
Using Analytics FC’s Coach ID tool, we can look at the style of the sides.
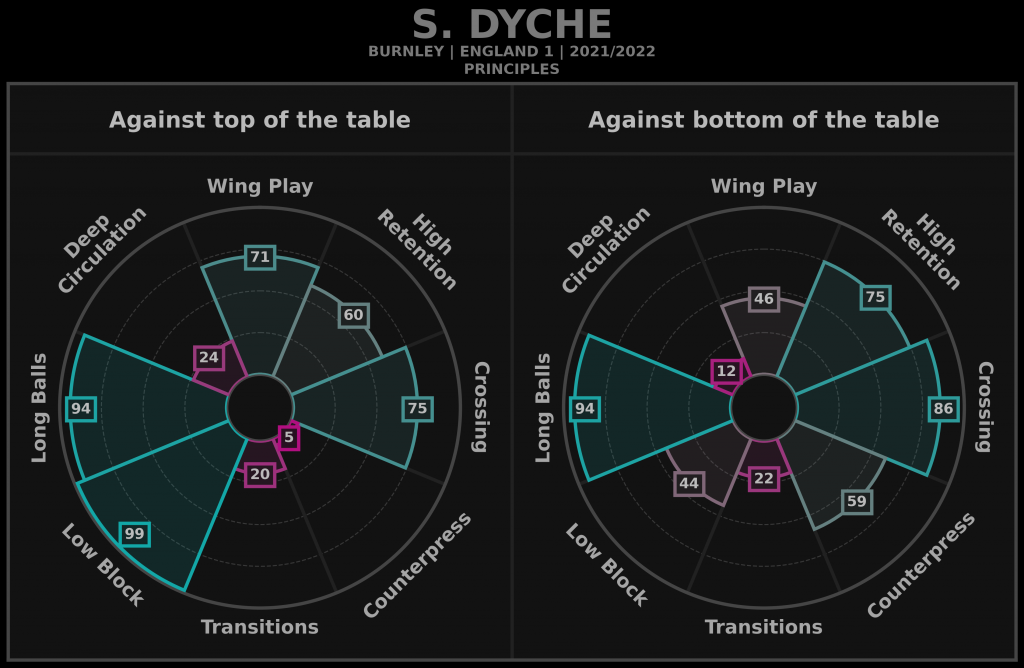
Here is Burnley. Pope achieves little in the way of xT, but also barely any xTA. This is very much in keeping with a predilection for long balls but also the ability to retain possession and, against lower quality sides, counterpress. Pope could get the ball forwards well, and for a team that could then block well and keep the ball high better than one might expect. Thus, while his efforts might not yield much in the way of xT, Burnley were geared to ensure that long passes didn’t result immediately in turning the ball over and giving up chances against.
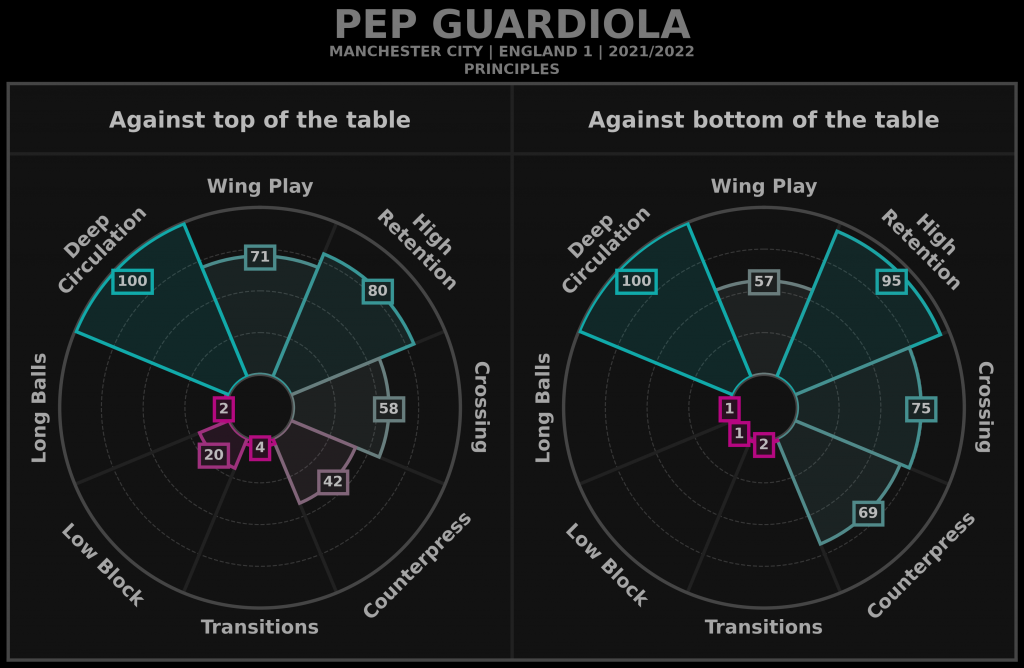
By contrast, Pep Guardiola’s Manchester City show quite the preference for deep circulation and barely any love for the long ball. They could keep the ball high and barely needed to transition, because they had so much possession. Having a goalkeeper like Ederson who is so comfortable on the ball obviously augments this style, and the recruitment of Stefan Ortega in the summer shows how passing ability is so important to how City rate ‘keepers.
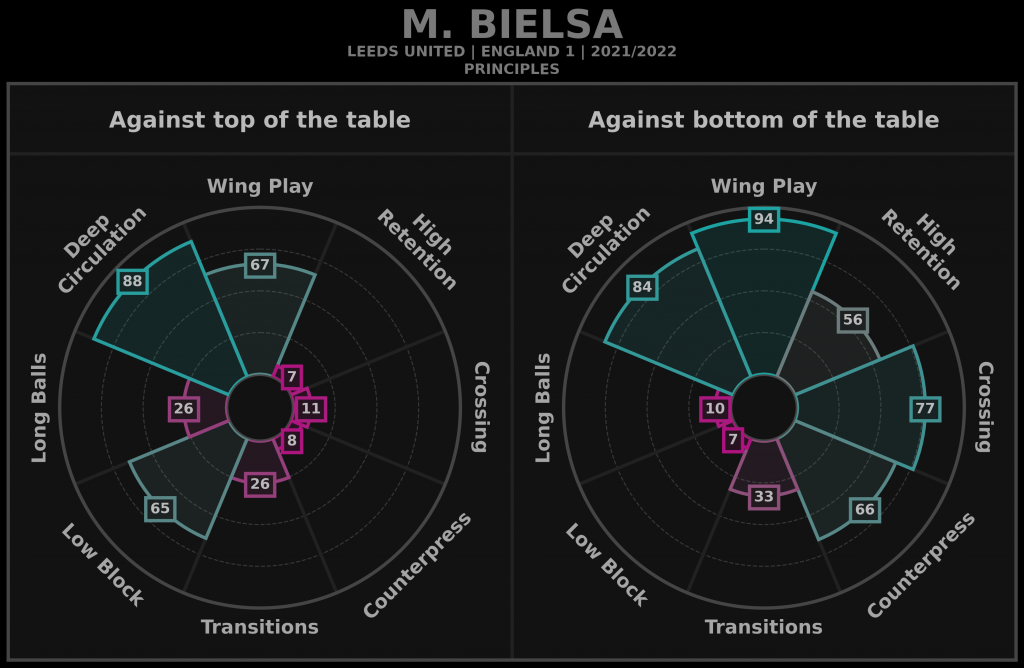
Illan Meslier was one of the less capable ‘keepers by our metrics, creating a very decent xT but giving up more xTA than any other ‘keeper in 2021/22. Marcelo Bielsa’s principles show, particulalry against weaker sides, a very Guardiola-esque approach (against stronger teams, Leeds blocked low more). Meslier, then, was capable of helping the passing out and it’s likely that his poor showing with regards to xTA is a combination of a few mistakes and/or needlessly risky passes, and Leeds’ desire to attack with numbers and intensity meaning that when they were turned over, Meslier was unusually exposed. This fits with what we know of how Leeds played, and why they struggled at times under Bielsa.
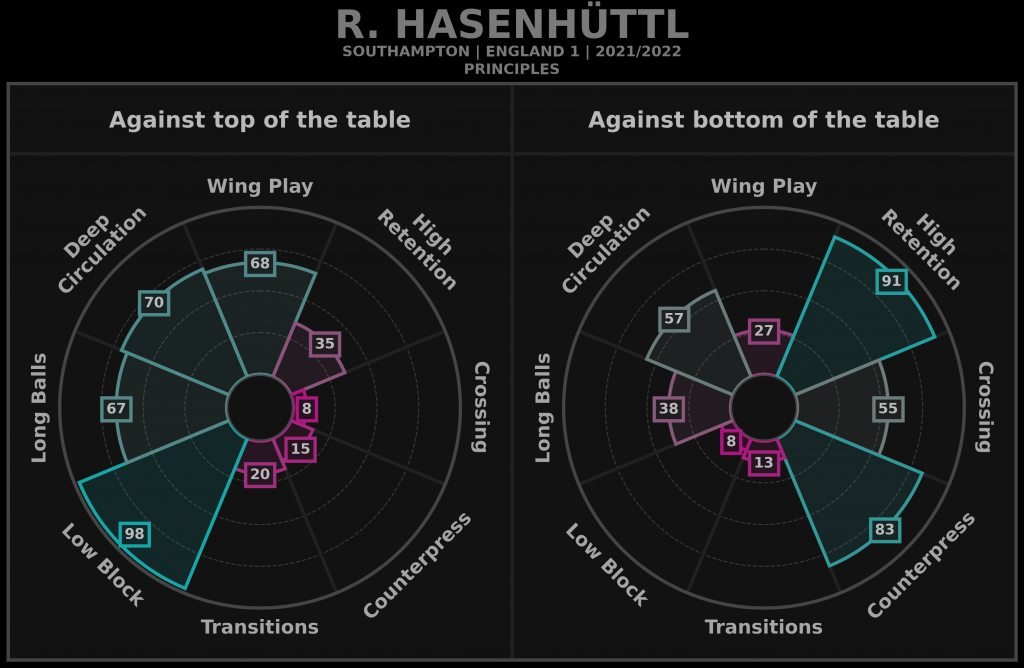
Lastly, another struggling team – Southampton – and one who actually split their keeping duties, with Forster playing 19 times in the league, and McCarthy playing 17 (Cabellero played twice). Firstly, it’s unusual to see such distinct styles against top and bottom sides, indicating that this Southampton team had difficulties creating, implementing, and sustaining a successful approach. But it’s also clear that against better sides, Southampton tried to hit it long but failed to make it stick, while against lesser sides, once they got the ball into the opposition third it tended to stay there, but they had issues achieving that. Both these aspects could account for Forster’s poor showing for both xT and xTA, and he is very definitely a more traditional goalkeeper who stays deeper and is more focussed on shot-stopping than build-up and passing. Nonetheless, while Forster’s passing has never been good, his poor performance in the data is likely as much (or more) to do with the fact that Southampton were poor and had little clear game-plan, as well as swapping between two rather different goalkeepers, than it is any inherent lack of ability.
What is clear then, when comparing player performance with team style, is that by and large, better teams who have better goalkeepers create more threat and expose themselves to less. It’s also clear that while there is some fluctuation between teams and ‘keepers, there’s surprisingly little difference between the bulk of players season-to-season, with most teams near an average of 0.275 xT and 0.138 xTA in both.
Risk vs reward
It is worth pausing here briefly to consider how we think about risk and reward. The aim of football is obviously to win by scoring more goals than your opponent, and this can be achieved by achieving a strategic balance between risk and reward (with some skill and luck added in). This balance could see a team being extremely gung-ho in attack and just attempting to score more than the opposition, however many the opposition also manage to score. Other teams may reverse this and seek to concede as infrequently as possible by minimising opportunities to be turned over, or sitting extremely deep. The flip side to this is lack of opportunity to score themselves, and so most teams try to effect a balance between the two approaches, depending on other factors like opposition strength, player availability, and so on.
So when we look at risk versus reward for goalkeepers, we mean the balance between attack and defence of course, but for ‘keepers there’s an added aspect that is worth keeping in mind. Building from the back, inviting a press and playing short passes near your own goal, is risky. Turnovers here have little distance to go before they pose a real threat. But passing very long with limited likelihood of retaining the ball also brings a real risk, especially if the team pushing up leaves too much space in behind, or doesn’t have a good mid-block structure. The ideal balance for most teams would probably be some form of mid-range possession, the Ramsdale-style clipped pass into the middle, although this too has risks.
Similarly, the reward aspect is variable. Being able to draw a team out so you can play quickly through the thirds or attack the exposed wide areas, as Guardiola sides seek to, is an obvious reward to deeper build-up involving the keeper, although the effect may need a few more possessions to manifest itself. But having a ‘keeper who can quickly kick (or throw) it accurately forwards to create much more immediate threat is also a reward. Ederson, of course, can do both.
The point, then, is less about the inherent risks or rewards of a specific style, and more about suitability of player to style, and style to player(s). This could mean the goalkeeper, but also those around them – it’s no good surrounding Ederson or Alisson with defenders who are not as adept as they are at possession. Similarly, encouraging a ‘keeper to kick long works best if they are accurate, but also if there is a good mid block, strong aerial ability to aim at, and the ability to counterpress second balls effectively.
As we have seen, some players are more exposed to risk of xTA because of style, while some players could thrive in any system, and some are better at passing than others. And this is what we would expect.
Football is a team sport, and seeking to quantify the risks or rewards of goalkeeping style is impossible without considering the abilities and effects of the rest of the side and the style they are trying to play. But some players are just better than others and finding those, and then building a system into which they fit, is the key to winning games.
The expected threat model was created by MarkStats using Karun Singh’s original article (https://karun.in/blog/expected-threat.html), StatsBomb public data (https://github.com/statsbomb/open-data), and code from the socceraction public repository (https://github.com/ML-KULeuven/socceraction). Raw event data for Premier-League seasons 21/22 and 22/23 was taken from Wyscout.
Header image copyright IMAGO/Action Pictures