
Sammy Lander has worked as a substitution coach for Wimbledon and consulted for Brighton and Hove Albion and the US Men’s National Team; here he shares a method for measuring the impact of players coming off the bench
Finding a singular numerical value to assess how successful any performance has been is always challenging, let alone when this performance is off the bench!
My role (as football’s first Substitution Coach) has led to me having conversations with many managers and players across various leagues, and one theme is a consistent: being and choosing a substitution is hard!
The amount of times that Ole Gunnar Solksjaer still comes up as the best substitute in this conversation (almost 15 years ago since that famous sub performance) goes to show how inconsistent, challenging and selective this role is. While conducting my research into substitutes there was a recurrent theme during conversations with football managers about why substitutes are so inconsistent: many managers still ‘sub with a hope’ and this hope isn’t always the most certain of factors to rely on. In modern football, where each Premier League table position can equal up to £2.2 million, relying on your gut is a risk some managers aren’t willing to leave to chance.
Therefore, trying to have some rationale and a process implemented that gives you direction to the right substitute (which isn’t always just the best) can really add some value across a season to scorelines.
Choosing a starting player uses (or should use) a holistic analysis of the player to assess whether they are ready to be trusted with a start, and it should be no different for a substitute. With this in mind, the metric that I have developed should always be used as part of a fuller picture or layered process.
I believe this metric will be a huge resource in assisting managers to have more knowledge around their substitutions and also a way to more effectively judge the value they have added or lost in the game. And so, I am introducing:
(xI) Expected Impact: a numerical value that measures the probability of how the action of a specific substitution will affect the value added or lost in a team performance.
How is it calculated?
This value is worked out by resetting the game’s xG values back to 0.00 when the player enters the game and using the xG result from the time while the player is active on the pitch as the way to create a value that indicates this individual’s impact on the game and performance.
The aim of the metric is to offer an insight into how value has been added or lost to a team’s performance. Many metrics that are currently active adapt a more outcome-based or event-based perspective; however, football is one of few sports that you can dominate principles of the game and still lose! This metric feeds into the modern way of thinking with a more process assessment of performance.
The metric in action
I see most common way of using this metric is for individual performances.
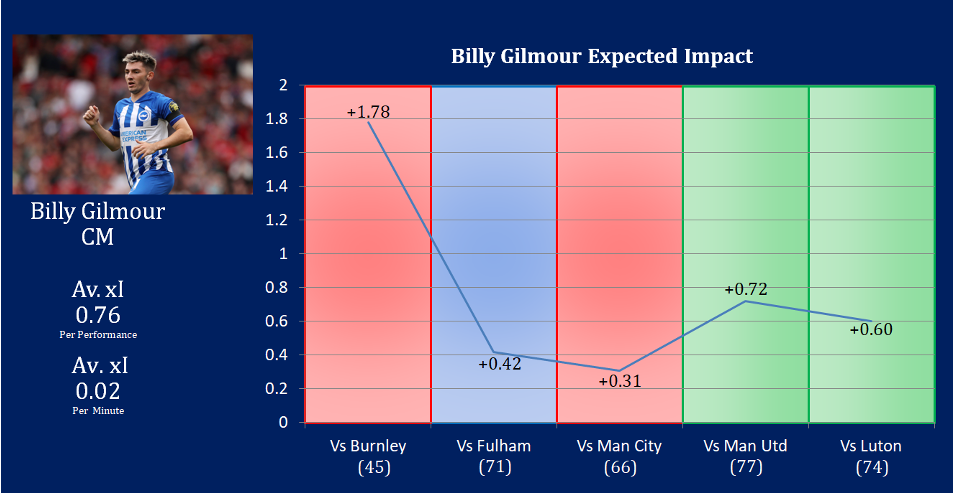
The above example uses Billy Gilmour. Gilmour’s expected impact (xI) is 0.76 per substitute performance, roughly equivalent to the xG of a penalty. Of the teams I am tracking in the Premier League, this average output makes him one of the most impactful players.
Gilmour’s xI per minute is (+) 0.02. While the overall xI value gives you indication into good and bad substitutes, the minute counter could also offer direction into how long you should give that player, in order for him to positively impact the scoreline. The analysis of Gilmour and his performance is across a range of game states, as well as opposition and even tactical styles. This sort of insight might help a manager establish the sort of value that Gilmour can add into a game and he might therefore become a no-brainer when the manager turns around to look at his bench.
The metric can also be used to help managers have a better understanding of how their substitutes fair across a certain game state; I have used Chelsea as this example in the image below.
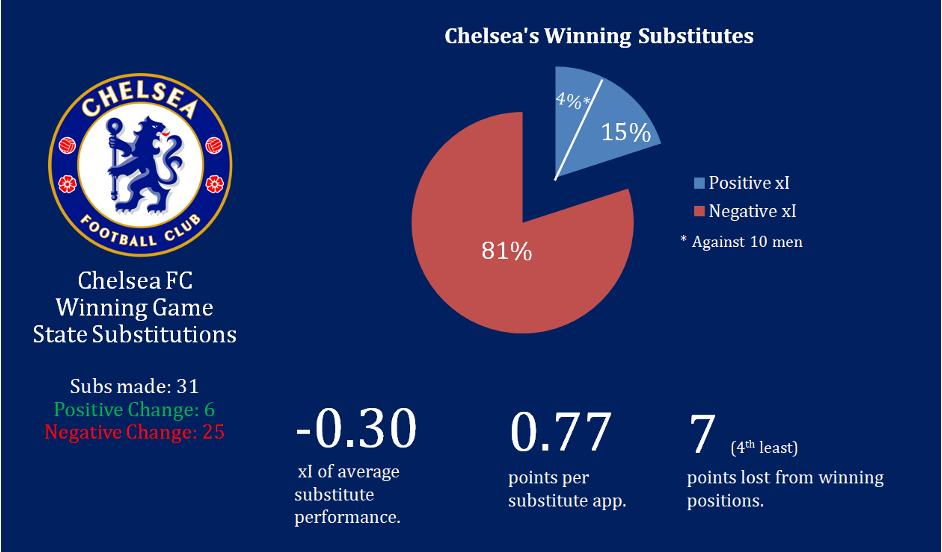
From the above graphic, we can see that 81% of Chelsea’s winning game-state substitutes out of the last 31 have entered the game and registered a negative xI. The average winning Chelsea substitute performance is an xI of -0.30. There might be a discussion to suggest that when a team goes ahead, they might adapt a slightly more defensive style, but to concede xG still points towards the substitutes not filling their role. On this occasion, this performance metric aligns with an outcome metric as Chelsea’s winning substitute points per game is 0.77. This suggests that when Chelsea make substitutes when winning, performance and outcome ultimately gets worst.
Interestingly, Chelsea have only lost 7 points from losing positions which is the 4th fewest in the league (at time of writing), meaning when you add contextual layers to Expected Impact it might be inferred that Chelsea could be better leaving their existing 11 on the pitch in order to see the victory out. This has the potential to be applied across a managerial reign to distinguish the impact the bench players make, in each game state.
Impact of tactics on xI
Finally during my research, there are some really interesting examples whose Expected Impact is very inconsistent – some very positive performances, others very negative. A good example of this is Brentford player, Yegor Yarmolyk.
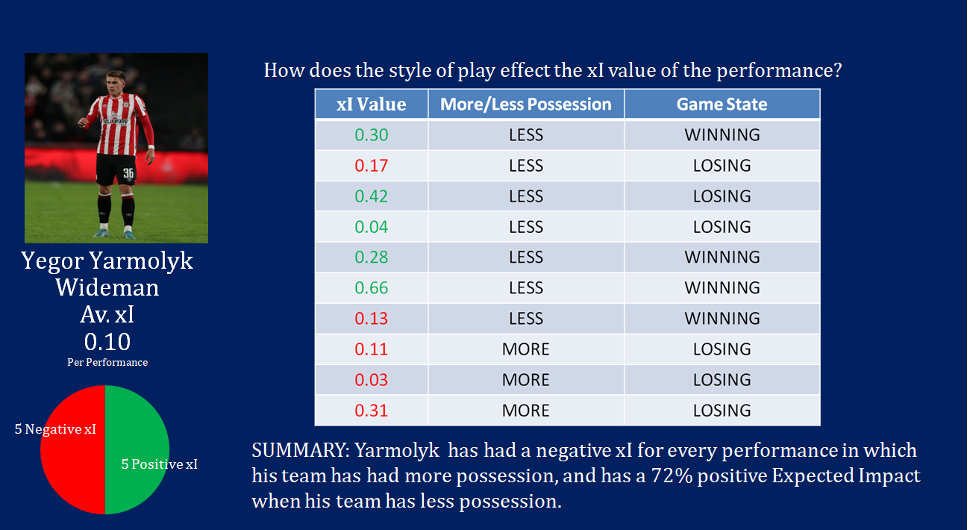
Yarmolyk in his last 10 performances has seen five positive xI’s and five negative xI’s, all while being in the same shape, and same position. This resulted in Yarmolyk’s Expected Impact being a positive 0.10 per performance, but this isn’t necessarily the headline information from this data, due to his inconsistencies. This led to me conducting some further research as to why the values varied so much.
The data revealed that every negative xI performance from Yarmolyk was actually when his team had actually out-possessed the opposition while he was on the pitch, and 72% of his positive xI performances had come when Brentford sat a little deeper and would surrender possession in order to counter. Having access to this insight, when considering the tactical styles of each team, is an important factor that will influence which player you decide to select to make that all-important impact. As suggested earlier in the article, the best players don’t always make the right substitutes and this is an example where Yarmolyk suits certain games better than others. This same theory can be applied to a wide range of factors, all of which could be subject to deeper analysis, including whether games are home/away, various game states, possession, and team formations.
I don’t think there will ever be just one number that a manager can rely on to understand performance, particularly with something like a substitute, whose role can change throughout the game minute by minute. However, this value offers a new insight and will assist teams in becoming more aware and deliberate with their substitutes, and hopefully help to create the next generation of Ole Gunnar Solksjaer’s.
If you would be interested in hearing more about how I am modernising the role of a substitute, or would like this metric implemented at your football club, please don’t hesitate in reaching out to me!
Header image copyright IMAGO/ActionPlus/Katie Chan