
Analytics FC Head of Context Alex Stewart revisits a concept considered in a previous post and digs into squad composition and what bench players bring to their teams
Back in 2020, our CEO Jeremy Steele had a conversation with an EFL Head Coach, who broke down how he builds and manages his squad. You can read the full article here, but in short, quoting from the piece:
The squad is then broken down into sub-groups. These groups have specific criteria when deciding which players form part of them. We won’t list all of the criteria here but below you should get a flavour:
“Star Players” (5 Players)
These are players who will be providing the maximum output, the “difference makers”. They will also be earning the maximum wage that the club can afford within their wage structure. There is no restriction on age.
“Starters” (7 Players)
Give or take an injury or suspension, these players are the core of the team and are expected to start every match. They are identified as being “proven players” within the domestic league they are playing in. These players are often peak age players (24 – 28 years old).
“Bench Players” (5 Players)
These players are “recruited for attitude”. Scouting is focussed on finding players with the right character and with minimal injury history. These players will be mostly sitting on the bench. This can be difficult to get used to and requires a specific mindset. The behaviour in and around the dressing room and training ground needs to be of the highest standard. These players also need to be “good trainers”. This means having the ability to train consistently well and also be ready, physically and mentally to affect matches should they be called upon. These players will be on lower wages and there is no age restriction.
“Young Players” ( 5 players)
These players must be assessed by staff and scouts as having the ability to impact upon the “Starter” or “Star Player” category within a few years. If they are only deemed likely to impact upon the “bench player” category in the future they are not considered for this group. In addition, they should also have the potential to command a decent transfer fee in the future.
The approach outlined is intuitive and common sense, but this sort of strategic thinking is still relatively unusual in football.
Jeremy went on take those ‘bench players’, players ranked 13th-17th in minutes played per Premier League side, to assess how those five squad members performed for their respective sides in the 2017/18 season. And we have done the same again, except this time we are looking at last season, and we’ve added some detail.
Before we get to the good stuff, a few words on methodology and what we have taken into account. Firstly, we wanted to make sure that the distribution of minutes played was fairly consistent across teams. To do this, we took the team with the fewest players used (Manchester City, with 24), the team with the most players used (Southampton, with 36), and two teams in middle, Liverpool, who finished fifth, and Leicester City, who were relegated in 18th, and both used 28 players. We used total minutes played as 3420, although that doesn’t account for extra time unlike the actual minutes logged against individual players – it does, however, work as a base line for calculating average playing proportion. The results were:
| Team | League position | Total minutes by 12 most used players | Total minutes from ‘Bench Players’ | Average minutes per player (whole squad) | Number of players used | % of minutes played by First 12 | % of minutes played by ‘Bench’ |
| Manchester City | 1st | 2325 | 1484 | 1565 | 24 | 68.0 | 43.4 |
| Liverpool | 5th | 2291 | 1145 | 1342 | 28 | 67.0 | 33.5 |
| Leicester City | 18th | 2187 | 1104 | 1343 | 28 | 63.9 | 32.3 |
| Southampton | 20th | 2121 | 1179 | 1045 | 36 | 62.0 | 34.5 |
While not perfect, we can see clearly that although Manchester City had a much greater proportion of minutes from their ‘bench players’, as makes sense given their smaller number of players used, there is little to choose between the other three sides. This means we can fairly confidently look at the distribution of impact among players 13-17 for each squad and assume they all played fairly similar numbers of minutes when grouped together, and so had a similar amount of time to make their impact.
To assess this impact, we used Analytics FC’s Goal Difference Added model. This model ascribes positive or negative values to every action on the pitch in terms of how it affects a team’s likelihood of scoring or conceding. You can find out more about the model here.
And here are the results, showing the sum of each squad’s five players in the 13-17 minutes played slots, ranked by GDA per 90 sum.
| Club | League position | Average age 13-17 | GDA per 90 sum |
| Liverpool | 5th | 27.4 | 0.7441 |
| Brighton & Hove Albion | 6th | 23 | 0.6611 |
| Manchester City | 1st | 25.6 | 0.6172 |
| Fulham | 10th | 27.4 | 0.6136 |
| Newcastle United | 4th | 25.8 | 0.5941 |
| Leeds United | 19th | 23.4 | 0.5518 |
| Chelsea | 12th | 26 | 0.4935 |
| Manchester United | 3rd | 26 | 0.4686 |
| Nottingham Forest | 16th | 27 | 0.4554 |
| Arsenal | 2nd | 26.2 | 0.434 |
| Southampton | 20th | 25.6 | 0.3159 |
| Wolverhampton Wanderers | 13th | 26.2 | 0.1956 |
| Aston Villa | 7th | 29 | 0.1496 |
| West Ham United | 14th | 26.4 | 0.1288 |
| Tottenham Hotspur | 8th | 25.4 | 0.0523 |
| Crystal Palace | 11th | 26.8 | 0.0327 |
| Brentford | 9th | 25 | -0.0059 |
| Leicester City | 18th | 25.6 | -0.0982 |
| Everton | 17th | 24.2 | -0.1573 |
| Bournemouth | 15th | 24.4 | -0.348 |
And, before we dig into what the above means, here are the top 20 individual contributors per 90:
| Player | Club | Age | Position | GDA per 90 |
| Roberto Firmino | Liverpool | 30 | FW | 0.3146 |
| Anthony Martial | Manchester United | 26 | FW | 0.296 |
| Diogo Jota | Liverpool | 25 | FW | 0.2397 |
| Allan Saint-Maximin | Newcastle United | 25 | FW | 0.2309 |
| Reece James | Chelsea | 22 | DF | 0.2236 |
| Phil Foden | Manchester City | 22 | FW | 0.22 |
| Richarlison | Tottenham Hotspur | 25 | FW | 0.2042 |
| Tom Cairney | Fulham | 31 | MF | 0.1976 |
| Leandro Trossard | Arsenal | 27 | FW | 0.1967 |
| Leandro Trossard | Brighton & Hove Albion | 27 | FW | 0.1967 |
| Junior Firpo | Leeds United | 25 | DF | 0.1877 |
| Jacob Murphy | Newcastle United | 27 | FW | 0.1875 |
| Adam Lallana | Brighton & Hove Albion | 34 | MF | 0.1804 |
| Joao Cancelo | Manchester City | 28 | DF | 0.164 |
| Ben Chilwell | Chelsea | 25 | DF | 0.162 |
| Lyanco | Southampton | 25 | DF | 0.1617 |
| Dango Ouattara | Bournemouth | 20 | FW | 0.1514 |
| Harry Wilson | Fulham | 25 | FW | 0.1474 |
| Matt Targett | Newcastle United | 26 | DF | 0.1469 |
| Taiwo Awoniyi | Nottingham Forest | 24 | FW | 0.1434 |
| Jaidon Anthony | Bournemouth | 22 | FW | 0.1427 |
The sharp-eyed among you will have noticed that Leandro Trossard appears twice – this is a function of how we calculate GDA by season and based on team strength.
Otherwise, what is immediately apparent is that Liverpool’s rotating cast of forwards was a significant boost for them in terms of output, while forwards or attacking midfielders in general dominate the list, supported by attacking full backs (Reece James and Ben Chilwell would surely have qualified for Chelsea’s most used 12 were it not for injury). Players with pace who can exploit late game transitions like Saint-Maximin, Murphy, and Ouattara are also unsurprisingly high bench contributors. Smart, experienced deep-lying passers Tom Cairney and Adam Lallana are the only two midfielders on the list, but added real value to Fulham and Brighton respectively.
Let’s now take a closer look at what the data tells us about some of the teams above.
Liverpool: While Roberto Firmino was injured for 10 games, which is probably what pushed him down to ‘bench player’ category, the 2022/23 Liverpool squad saw two starting sets of forwards: pick three from Salah, Nunez, Gakpo, Jota, Diaz, and Firmino, with Elliott also getting over 1600 minutes between midfield and the forward line. This shows the strength of having attacking options for rotation or off the bench; as we can see, forwards brought the biggest sum of GDA per 90 and the highest average GDA per 90 per player.
| Position | Sum of GDA per 90 | Number of players | Average GDA per player |
| Forwards | 3.6641 | 38 | 0.096 |
| Defenders | 2.5801 | 39 | 0.066 |
| Midfielders | 1.3383 | 19 | 0.070 |
There are two possible reasons for this, both of which make sense depending on the side. Bigger, better teams can acquire a range of quality forwards to rotate (Manchester City, Liverpool), while other teams may also benefit from high impact substitutes, especially quick attackers brought on to score clutch goals. Either way, making sure your squad has depth in forward positions seems to bring a clear advantge.
Brighton & Hove Albion: Imagine Brighton bucking a trend and succeeding! Brighton derived the second highest cumulative GDA per 90 from its ‘bench players’, but Trossard (27) and Lallana (34) are the two that make it into the top 20. Why is this interesting? Because Brighton’s ‘bench’ had the lowest average age (23), while only three other clubs (Leeds United, relegated in 19th; Everton, 17th; and Bournemouth, 15th) had ‘bench player’ average ages of under 25 (for further context, when weighted by minutes played, only two Premier League teams had squads whose average age was under 25, Arsenal and relegated Southampton).
So Brighton not only had the youngest ‘bench’, but they also accrued the second highest sum of GDA per 90 from them and finished in the top six (unlike the others, who all flirted with, or were fully seduced by, relegation). What’s more remarkable is that they also had the third oldest player on the list, Lallana (after Jonny Evans and Fraser Forster – Evans actually did very well, 25th best by GDA per 90 of the 100 players we assessed, making his move back to Manchester United perhaps a little more sensible than it first appeared). Lallana and Evans are exactly the kind of players you would want on your bench, experienced, able to deliver when required, but not needed to start all the time (and bringing additional, hard-to-quantify value in terms of mentoring younger players, leadership, and so on).
Brighton’s youngsters, Evan Ferguson, Julio Enciso, and Levi Colwill (on loan from Chelsea), all contributed despite the likely intention being to give them exposure to first team football more than regularly rely on them. In this, Brighton have maybe used their ‘Young Players’ more than expected (according to our EFL coach’s taxonomy above), but given their reputation for development, this is hardly a surprise. Brighton’s balance of experience and youth shows excellent squad management and it delivered for them.
The relegated sides (Leicester City, Leeds United, and Southampton): A mixed bag here – Leeds came 6th on our list, with Southampton 11th and Leicester, again, 18th. Interestingly, we can compare injury rates here too: Leicester (36) and Southampton (34) faired far better by injury volume than Leeds United (53), according to a study. Leeds’ ‘bench players’ were a mix of defenders (Cooper, Firpo, and Wober) and two young attacker being given experience (Gnonto and Summerville), and between them they did very well despite the injury issues and generally having a tough time on the pitch.
Leicester and Southampton had fewer injuries, but Southampton used many more players, a symptom of three managers in one season (four, if you count Selles twice). Saints’ ‘bench players’, Lyanco, Alcaraz, Walcott, Aribo, and Armstrong suffered from this to a degree: while Alacaraz joined in January and Armstrong was used consistently, Aribo fell out of favour with Jones and struggled to get back into the side, Walcott was out under Hasenhuttl, in and out and injured under Jones, and in under Selles, and Lyanco was a starter, a sub, or dropped altogether from a team that could not decide its best defensive set-up at all under any of the three managers. The performances of some of these bench players, Lyanco and Alcaraz in particular, probably saved Southampton from being even worse off, but this is a picture of poor planning and some individual quality, rather than good squad management, when one considers the use of the squad as a whole.
Leicester City, by contrast, were more like Leeds United (two good younger attackers, a good senior defender) but were hampered by the performance of substitute ‘keeper Daniel Iversen. Iversen, who played just over 1000 minutes, and, indeed, Danny Ward, who was the starter, were probably not ready to step into the breach left by club legend Kasper Schmeichel; both ‘keepers had negative post-shot expected goals numbers for the season and Iversen’s contribution was the second lowest of all 100 players we looked at, to Bournemouth’s Mark Travers, another ‘keeper who put up negative PSxG (this just shows how hard it is to come in as a back-up goalie and, indeed, a goalie in general, when fewer than half the PL’s ‘keepers had positive PSxG for the season). By expected goal difference, Leicester were comfortably the most unlucky relegated team, finishing 13th in the xGD table instead of the 18th they finished in in real-life, and they were probably similarly unlucky in our GDA ‘bench’ league, with altogether less serious consequences. This does, however, show the value of really investing in your strength in depth in every position.
Manchester City: lastly, to the title winners, and for one reason only – if we look back at the EFL Coach’s set-up at the beginning of five stars, seven first teamers, five bench players, and five youngsters, City are the squad who most closely resemble this ideal squad. By minutes, their top five players were Ederson, one of the world’s best goalkeepers and integral to their playing style (by the way, his replacement, Stefan Ortega, was the highest ranked keeper by GDA per 90 in the league that season by a huge margin), Rodri, the world’s best number six, Erling Haaland, the world’s most potent striker, Kevin De Bruyne, the best all-round footballer in the world and the PL’s highest player for GDA per 90 in 2022/23, and Ilkay Gundogan, a hugely versatile and tactically intelligent midfielder with the joint-fifth highest goals per assists in the squad. Four of those five are the absolute spine of the team.
The next seven players: Akanji, Silva, Grealish, Dias, Walker, Mahrez, and Ake. That’s the back four, the third midfielder, and two difference-makers out wide. The next five, the ‘bench players’: Stones during his conversion to roaming CB, Foden, still only 22 , Alvarez, still only 22, Cancelo, slight victim of a tactical shift and who left halfway through the season, and Laporte, who would stroll in most other sides and who had started 33 games the previous season. This is an ideal mix of youth and experience, all high quality players who can be relied on to step up when needed but without being needed all the time. Lastly, most of the rest of City’s used players (Lewis, Palmer, Gomez, Charles, Perrone) were 21 or under, with only Ortega and injury-hit Phillips not. That, dear readers, is squad planning.
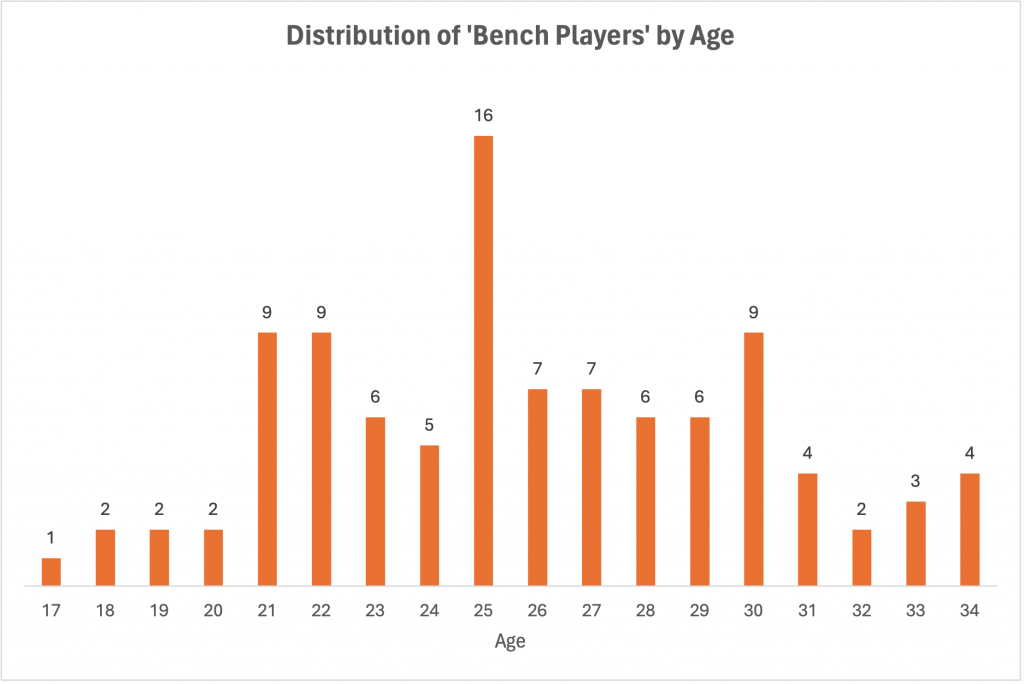
One further thing: While the proposed squad breakdown at the beginning of this article specifically says there is no ‘age restriction’ for ‘bench players’, the distribution certainly seems to show that these players are largely distributed in line with what you’d expect the average squad to be, between 21 and 30, with a peak that is slightly younger than the overall average squad age in the Premier League, 25 versus around 26.6. This makes sense given the blurring between ‘bench players’ and ‘young players’, especially those like Foden, Reece James, or Liverpool’s Curtis Jones (all of whom were arguably good enough to start for their respective teams anyway).
It’s also worth saying that the average age of the top 20 ‘bench players’ is the same as the average age of whole 100, so there’s no weird skew towards a few heavy hitters who are actually peak age while everyone else is creaking or just emerging from the U23s.
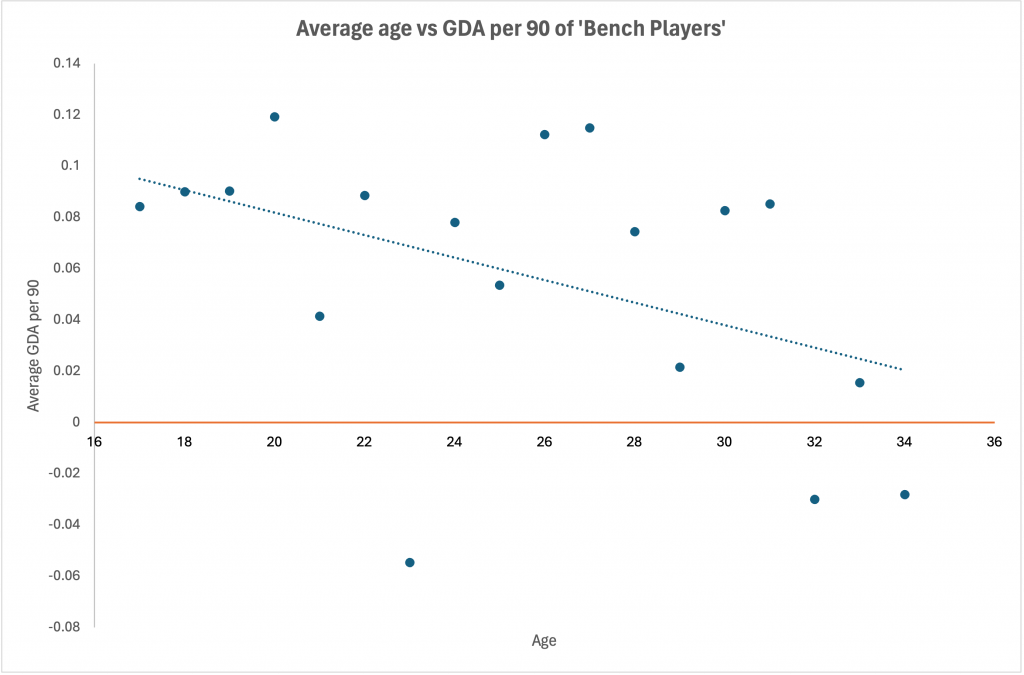
What is interesting is that, although it’s very, very messy, there is a downward trend among ‘bench players’ in terms of output as they age. It would arguably be stronger were it not for 23-year-old Mark Travers bringing that year down hugely and, while it’s clear that you can still get good value from 34-year-olds (for every Fraser Forster there’s a Lallana or an Evans), from a squad planning perspective it might be worth giving more time to younger players for the other upsides that gets you, without worrying too much that you will see a huge drop-off in GDA on the basis of a lack of experience. That said, this is a messy chart with small sample sizes for each age, so don’t read too much into it!
Conclusion: while this was only one season’s data, they do suggest that there is definitely value in assessing ‘bench player’ contributions and planning squads with minutes and contribution distribution in mind. If the players 13 to 17 in your squad are going to be playing around 1100 minutes each, they have a lot of time in which to make a positive or negative impact. How this informs your strategy may vary: you might wish to snap up a more highly-rated reserve keeper (perhaps using our insights in this piece), blood your younger attackers earlier and more frequently, or keep a steadying, and creative, midfielder on the books for one more season (after all, passing is one of the skill sets that degrades slowest with age).
And, with many leagues moving to five substitutions during a game, how this pool of players is used is ripe for analysis and strategic thinking. Hopefully this piece has provided a grounding in how we might go about thinking about, and using, ‘bench players’; as Jeremy said in his article of 2020: “The ‘bench player’ may not be the most glamorous, but they could certainly be the difference maker over the course of an arduous league campaign.”
Minutes data from FBref.com; header image copyright IMAGO / Colorsport