Eduin Latimer looks at how well goalkeeping metrics isolate from team performances and whether that can shed light on transfers for the position
Manchester United’s £43m gamble
Manchester United have a new goalkeeper. They spent £43m, the third highest fee ever paid for a goalkeeper, to purchase Andre Onana from Inter Milan. Onana is coming off a great season for Inter Milan. He kept clean sheets in 43% of his matches in the last year, putting him in the 90th percentile for all goalkeepers in the Top 5 football leagues.
He has also been praised for his confidence on the ball. This is a key reason that Manchester United decided to replace their previous goalkeeper, David de Gea, with Onana. Erik Ten Hag, the Manchester United manager justified the transfer by saying: “football…demands good playing from the back, out-playing qualities, and that is a quality Andre has.” The statistics support this view. Onana completed 55% of his long passes last season whereas De Gea completed only 45% of his.
But a question remains. Can Onana replicate his confident performances at his new team? Statistics are an increasingly important part of scouting players and given the size of Manchester United recruitment department, Onana’s stats have certainly been scrutinised in every way possible. But are a player’s statistics in a previous team a good guide for how they will perform in a new team?
How well do goalkeeper statistics isolate individual performance from team performance?
To explore this question, I’ve used data on goalkeepers from between 2017/18-2022/23 in the big 5 leagues to show how much transfers affect goalkeepers’ performances. I compare the year-on-year volatility in performances for goalkeepers who stay at the same team to those who switch teams. If a statistic is purely a function of the individual goalkeeper’s skills, we would expect performances to vary a similar amount year-on-year, independent of whether player’s switch teams or stay in the same team. Alternatively, if a statistic depends on the rest of the player’s team, we expect the statistic to change more in seasons when the player moves.
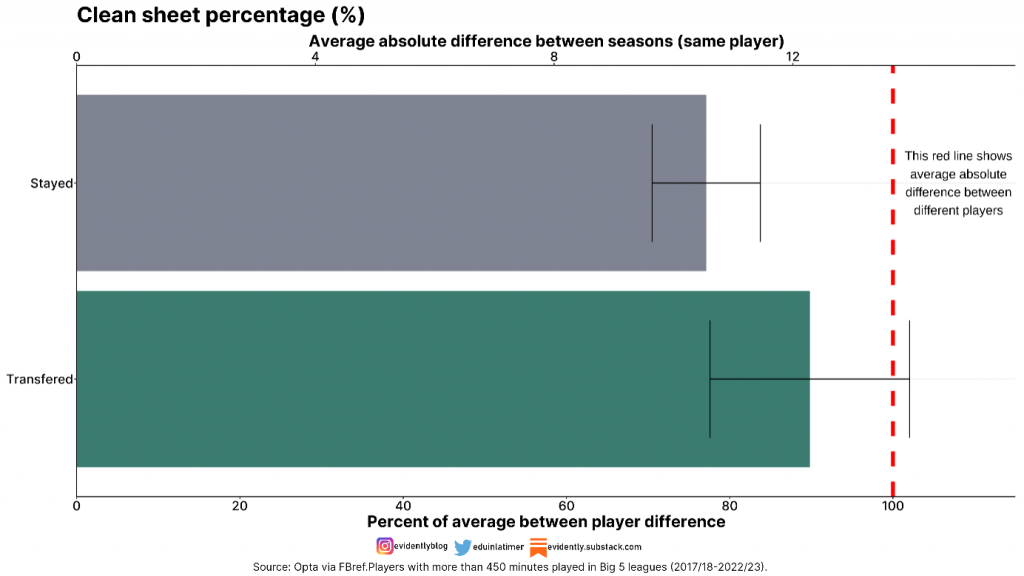
The below chart shows that clean sheet percentages vary more between seasons when a goalkeeper has transferred. Clean sheets depend not just on a goalkeeper making good saves, but defenders not allowing the other team good opportunities. On average for a goalkeeper who stays at the same team, their clean sheet percentage will change by 10.6 percentage points between seasons. For goalkeepers who switch teams, their clean sheet percentage varies more (12.3 percentage points.)
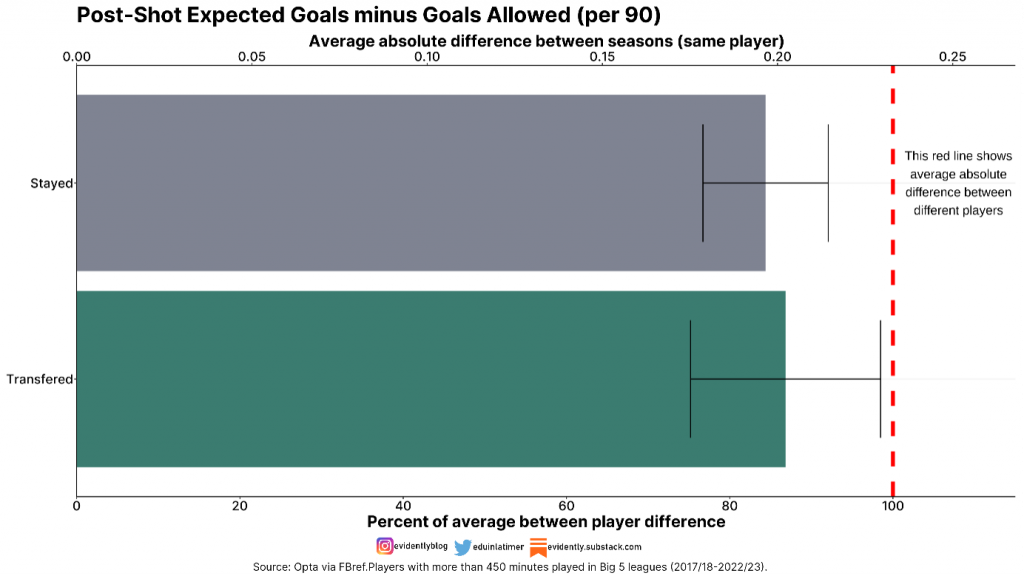
More advanced measures of goalkeeper’s saving ability can provide a more reliable guide to individual goalkeeper ability. The difference between post-shot expected goals (PsxG) and goals allowed (GA) is one of these more advanced measures. It measures the difference between the expected goals conceded, based on the quality of the shots a goalkeeper faces, and the actual goals conceded. There are similar levels of year-on-year volatility for players who switch teams as players who stay at the same team. This shows the metric better isolates the goalkeeper’s individual performance. However, there is still quite a lot of year-on-year volatility. On average a goalkeeper’s performance will change between seasons by 0.2 goals per 90, 85 percent of the difference between two random goalkeepers.
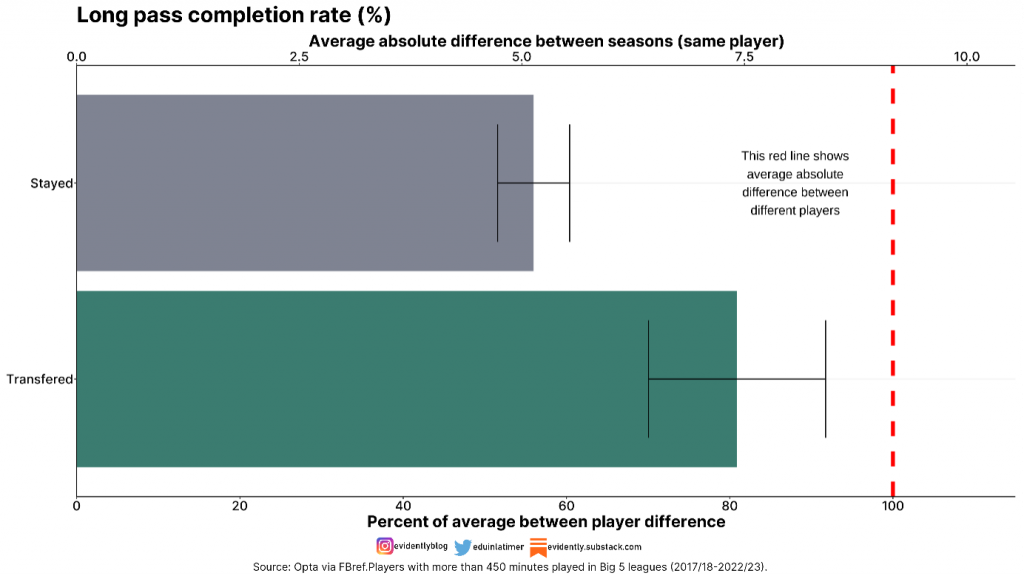
So how about passing metrics? Manchester United bought Onana specifically because of his passing ability. Do passing metrics also depend on the team a goalkeeper plays for? The chart below indicates they do. Long pass completion rate varies by on average 5.1 percentage points between seasons, for goalkeepers who stay at the same team, whereas it varies by 7.4 percentage points for keepers who switch teams. Part of the reason Onana has had such a good pass completion rate this season, is he had players who are good aerially to aim at such as Dzeko or Lukaku. We might expect his long pass completion rate to come back down as he moves to Manchester United.
Learning from Ramsdale’s move to Arsenal
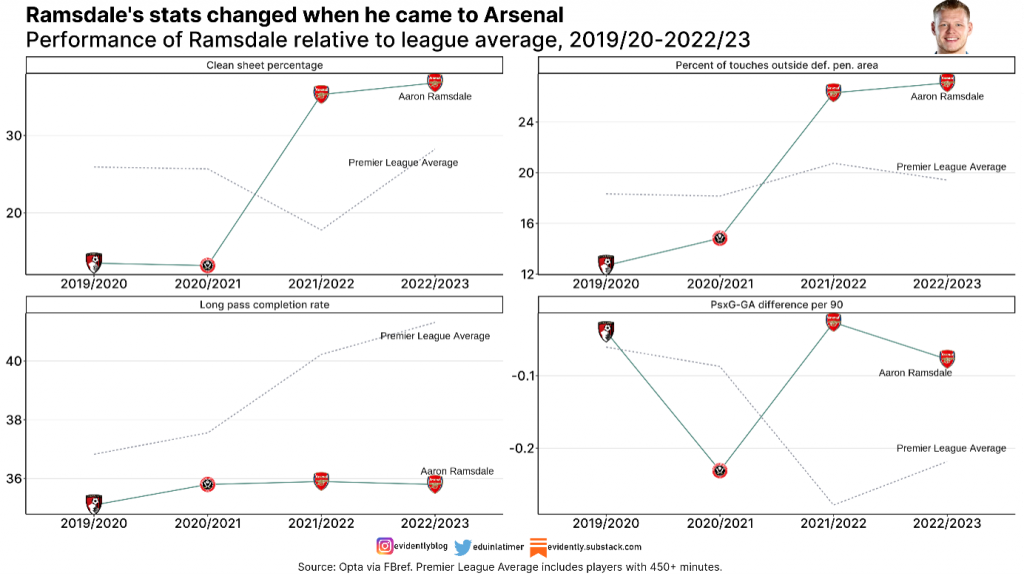
Aaron Ramsdale statistics are a good demonstration of how important a goalkeeper’s team is for their statistics. In his first two seasons in the Premier League he played for two struggling teams (Bournemouth and Sheffield United). He then made a surprise move to Arsenal, a much better team. After moving to Arsenal, some of his statistics changed dramatically. His clean sheet percentage surged from less than 20 percent in his first two seasons to more than 30 percent in his two seasons with Arsenal. When he was playing with a better defence, he became less likely to concede. His share of touches outside the defensive penalty area increased dramatically when he moved to Arsenal. Arsenal play a much higher defensive line than his previous clubs. Despite previously not having much experience playing higher up the pitch, he did so successfully when he was asked to at Arsenal. This asks a very interesting question, too, of how much player adaptability is dependant on coaching: was Ramsdale just very adaptive, or were Arsenal’s coaches unusually successful at encouraging and supporting these changes?
Other statistics did not change as dramatically. His saving performances (measured as the difference between his post-shot expected goals and the goals he allowed) improved on arriving at Arsenal, but this could just be a bounce back from a single bad year in 2020/2021 at Sheffield United. His long pass completion rate did not change much despite the move to Arsenal. This might reflect relatively few good targets for long passes at Arsenal, similar to his previous teams.
What does this analysis mean?
This analysis suggests we should take caution when interpreting an individual goalkeeper’s statistics. Some traditional statistics such as clean sheet percentage are strongly affected by their team-mates and their opposition rather than their individual ability. We can’t expect them to replicate the exact same performances in a different environment. More advanced metrics such as the difference between goals allowed and post-shot expected goals do isolate an individual goalkeeper’s ability better, but they are still volatile measures of performance.
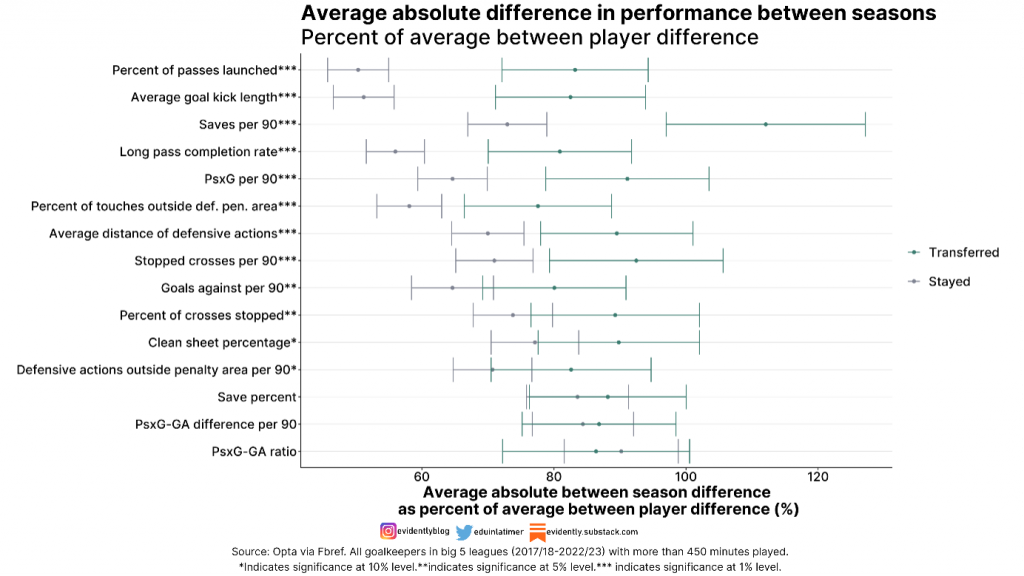
If we want to rely on a metric to predict a player’s future performance we don’t want it to be volatile over time. Obviously, players will change over time, and circumstances at their club will also change over time, so we would expect some change between seasons, but a metric with high volatility between seasons indicates that performance in an individual year is fairly random. This is shown in the summary graph as the central dot for “stayers”. The further left this is, the less volatile the measure is season-on-season for players who stay at the same club.
If the metric is a good measure of individual ability, it logically follows that players are able to replicate their performance in that metric in different scenarios. We would therefore expect performance to change a similar amount season-on-season for players who move clubs and those who stay the same. In terms of the summary graph below this means the difference between the central dot for stayers and movers. The smaller this difference between the two dots, the less affected the metric is by team environment.
For example, PSxG-GA difference (per 90) scores well on this second characteristic as the difference between year-on-year volatility for stayers and movers is small (and not statistically significant). However, as mentioned already, it doesn’t do that well for the first characteristic, because it is quite volatile between seasons for players who stay at the same club.
The summary chart below therefore shows which metrics are best at isolating individual goalkeeper ability from team performance. The bars around the points in the graph show the 95% confidence intervals around the estimates. It indicates how confident we can be in the estimates, the larger the number of observations, the tighter the bands will be around the central estimate.
So, what about Onana? Have Manchester United £43m on him after one particularly impressive season. Will his stats fall off when he arrives in a new environment? Potentially, although one thing in his favour is that he has already played under Eric Ten Hag at Ajax, so he is likely to be familiar with the manager and the playstyle. Perhaps Ten Hag knows how difficult it is to replicate performance in a new environment. His three biggest transfers since arriving at Manchester United have been players he’s already managed.
Header image copyright IMAGO / PRiME Media Images / Andy Rowland