
Aidan Reagh takes a look at performance and player salary data from the last eight seasons to determine whether football is seeing the impact of modern recruitment techniques.
In 2014, Martin Klienbard presented a paper at the MIT Sloan Sports Analytics Conference titled, “Can’t Buy Me Love: Why Money is not Baseball’s Most Valuable Currency”. The key finding of the paper was that despite payroll disparity growing larger in Major League Baseball, there was not a strong correlation between payroll and success. This suggested that teams with a small budget—such as the famed Oakland Athletics or perhaps the less commonly appreciated Tampa Bay Rays—are perhaps just as likely to put together a strong season as teams with a large budget—such as the famed Los Angeles Dodgers or the New York Yankees.
This finding offered an attractive proposition to other elite sports across the world: the possibility of a more sustainable route to success. For football, an industry that had become a watchword for financial mismanagement since the 90s, this was an opportunity not to be missed. Around the time of Martin Klienbard’s presentation in 2014, clubs began exploring the benefits of specialisation and sought to make improvements within their recruitment processes. By acquiring scouts who were well-versed in the use of data to work alongside mathematical specialists who could design complex models, recruitment departments were hopeful of achieving success on a tighter budget.
A decade on from this shift, we have now reached a point in time where we can test the dependability of the change. The question is: has the data revolution in football actually improved the financial outlook within the industry? In this article, we will investigate whether football’s investment into modernised recruitment techniques has actually borne any fruit.
Methodology
In order to answer the question at hand, we will be using Capology’s wage data from the top five leagues in Europe to assess the extent to which the landscape has changed since the 2013/14 season.
Salary data is notoriously difficult to collect so a little leeway is always important. However, Capology’s methodology and data set is surprisingly complete. Capology utilises “a network of insiders directly involved in contract negotiations as well as publications around the world. When these are still not sufficient, Capology’s algorithms provide a best estimate.”
Within their data, there are “verified” salaries which are defined as either having been confirmed by the player, their agent or by two or more sources. In the Premier League, the data is generally over 90% verified but can vary early in the season until more details are published. For example, last season, post-January transfer window, there were 495 salaries verified out of 512 (96.7%). Last season, in the pre-January transfer window, there were 523 verified out of 557 (93.9%).
One further thing to note is that the data only includes base salaries, so heavily incentivised contracts will fall through the cracks. As such, it’s fair to say that the data is by no means perfect but certainly gives us a strong foundation to build our analysis.
The Landscape in 2013/14
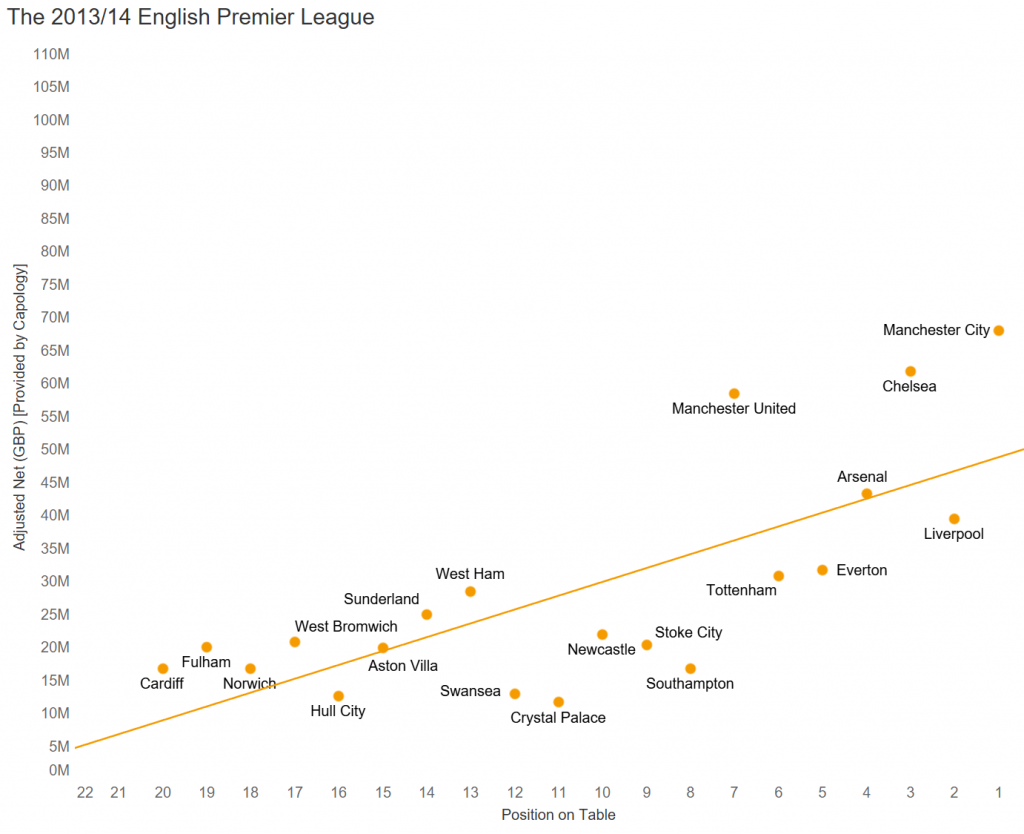
Let’s begin by taking a look at the state of affairs back in the 2013/14 season. Here is a graphic that shows the wage bills of clubs from the top five European leagues plotted against their finishing position in their respective leagues:

We can immediately draw a couple of conclusions. Firstly, the general trend is fairly obvious: the more you pay your players, the more likely you are to achieve success.
The second conclusion we can draw is also not surprising: the Premier League’s spending is significantly above average. In fact, in 2013/14, the only Premier League clubs who spent below the European trend line (indicating that the club perhaps achieved more than what would have been expected of them) are Southampton (finished 8th), Crystal Palace (finished 11th), and Swansea (finished 12th).
The problem that comes with all data visualisation is the need to contextualise. Figure 1 can allow for conclusions to be drawn without the necessary context being provided. For example, we could say that nearly every team in football overperformed outside of the Premier League, because we did not anticipate the fact that the Premier League’s average wage is incomparable to the other elite leagues of Europe. With that being said, let’s add the context we need by taking a deeper look at each individual league.
The English Premier League
The Premier League is perhaps the most renowned league when it comes to “money wins” logic thanks to the likes of Manchester City and Chelsea. Nevertheless, we have also seen the likes of Brighton and Norwich gaining traction for their more sustainable approaches in recent years.
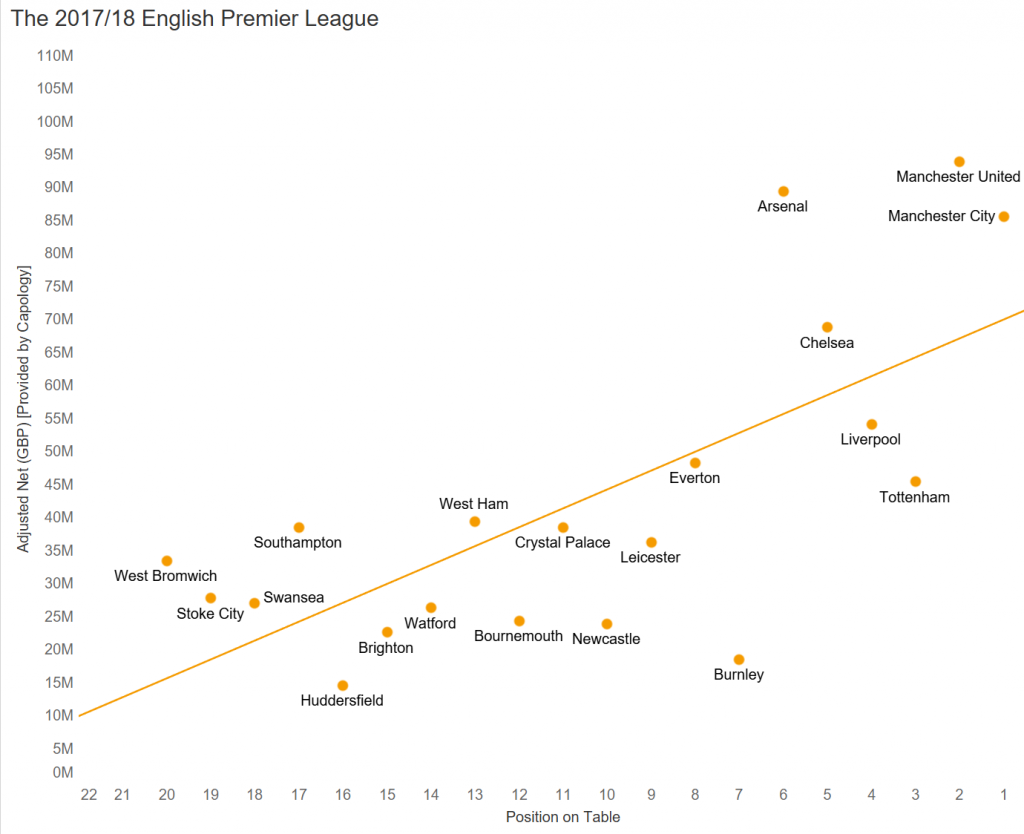
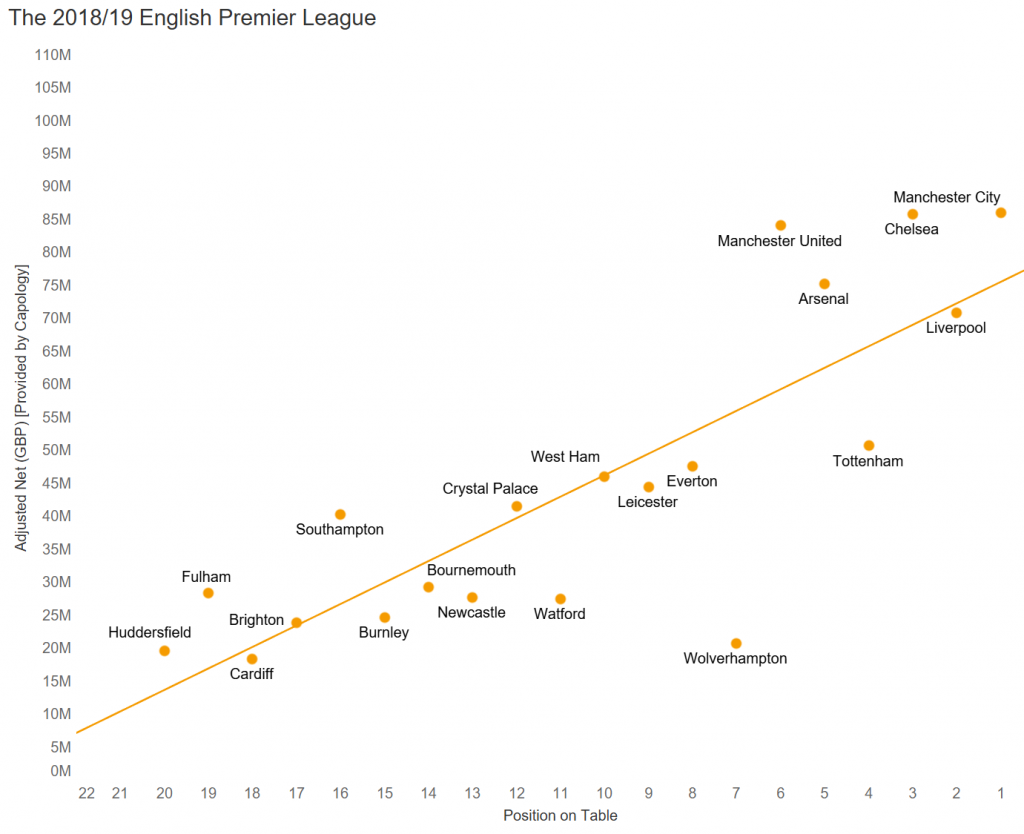
Looking at the club-by-club breakdown of the 2013/14 Premier League season, there are three distinct groups. These groups can be categorised as the big spenders, the overachievers, and the as-expected:

We can directly correlate these groups to a relative table position. For example, the big spenders (the traditional big six clubs and Everton) all find themselves finishing in the top 7. Our next group—the overachievers—should reasonably have finished around 15th or lower but instead found themselves around the midtable. Finally, we have the as-expected group. These clubs generally tracked the trendline for their wage bill.
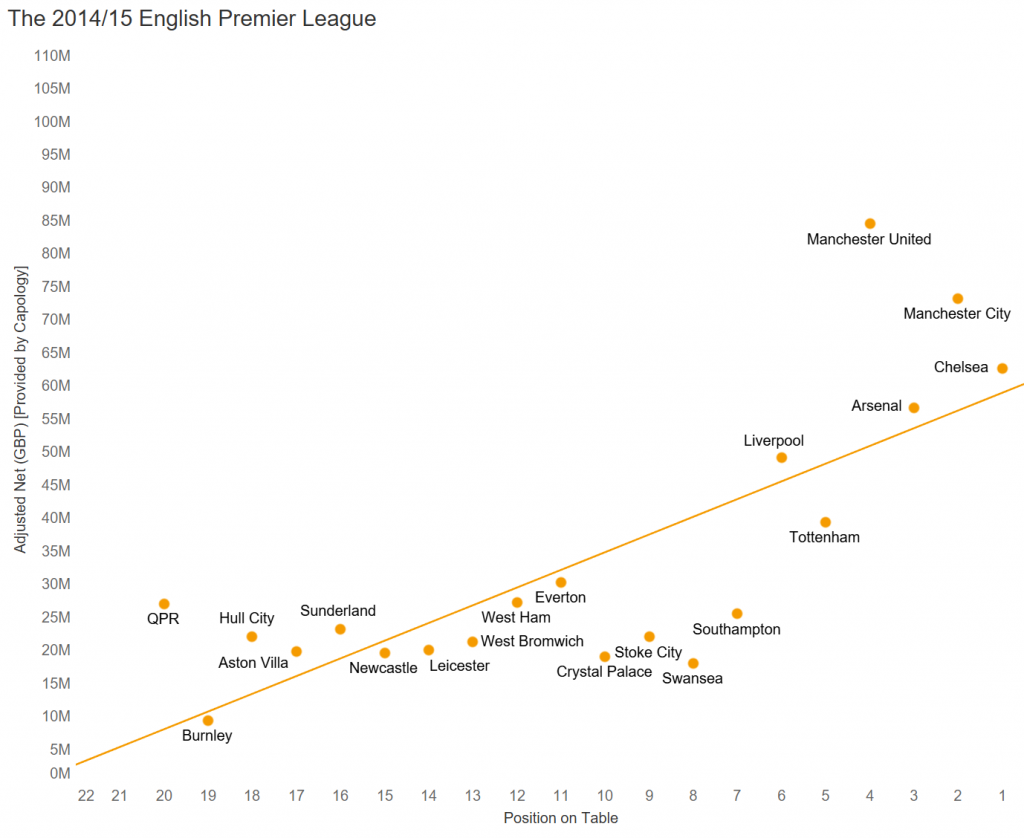
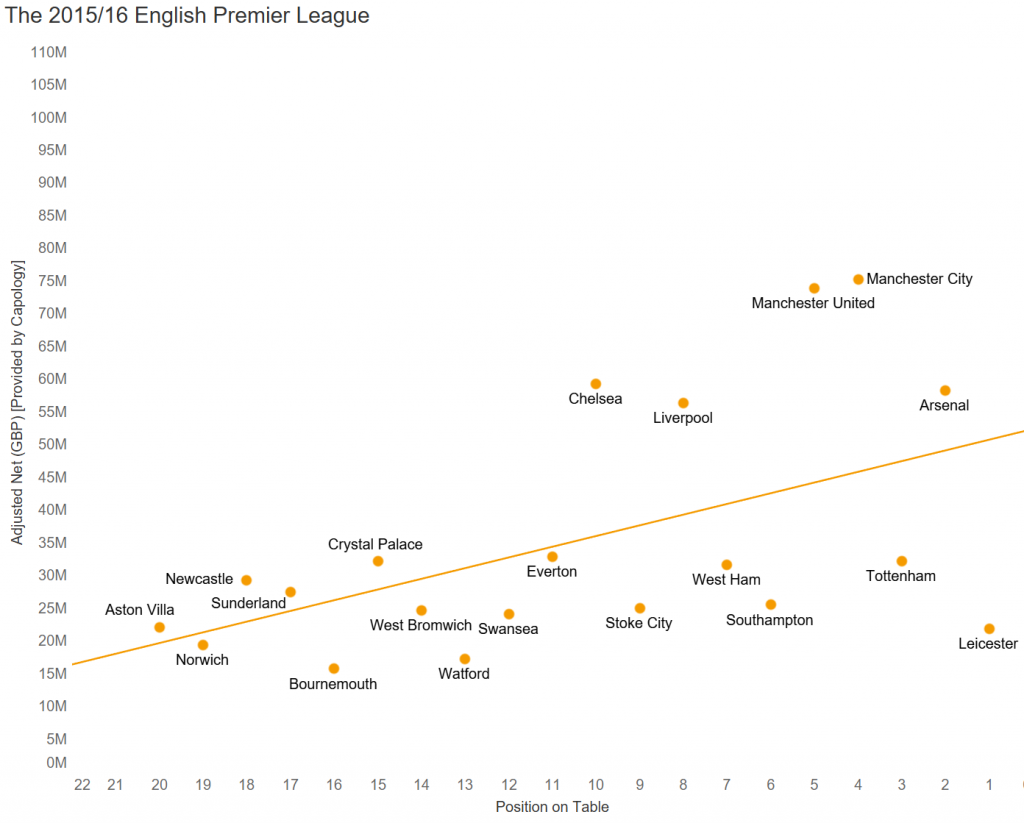
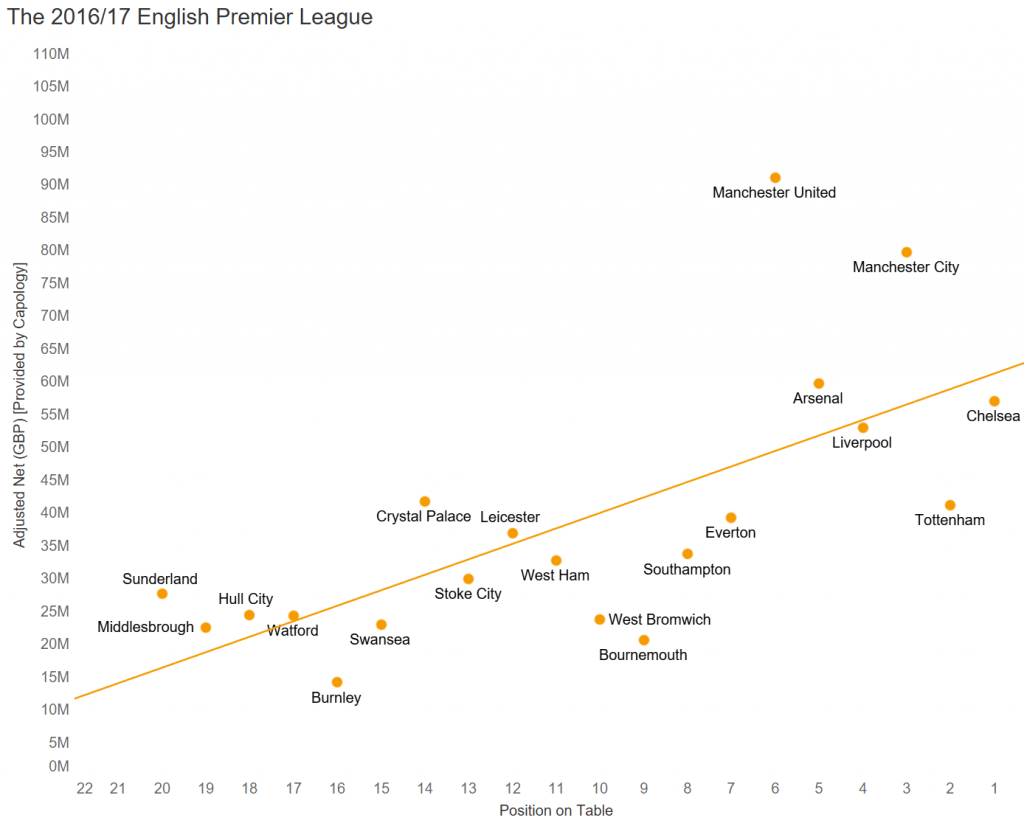
So how has the Premier League evolved? How does the Premier League look today?

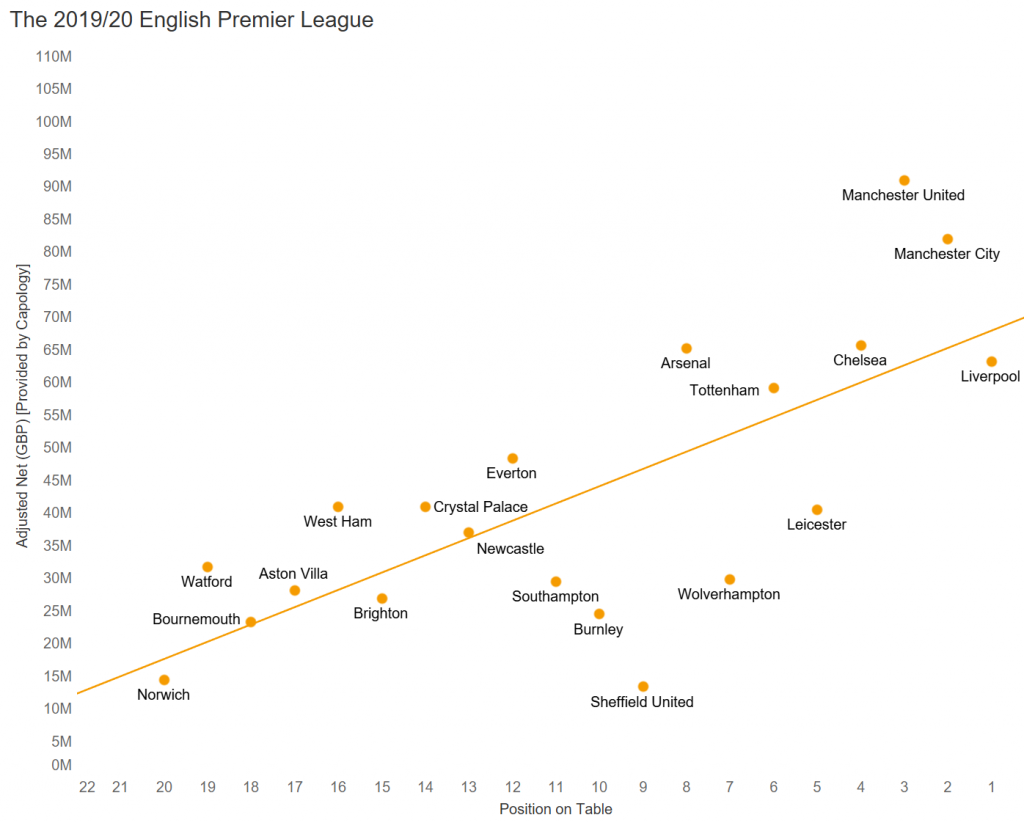
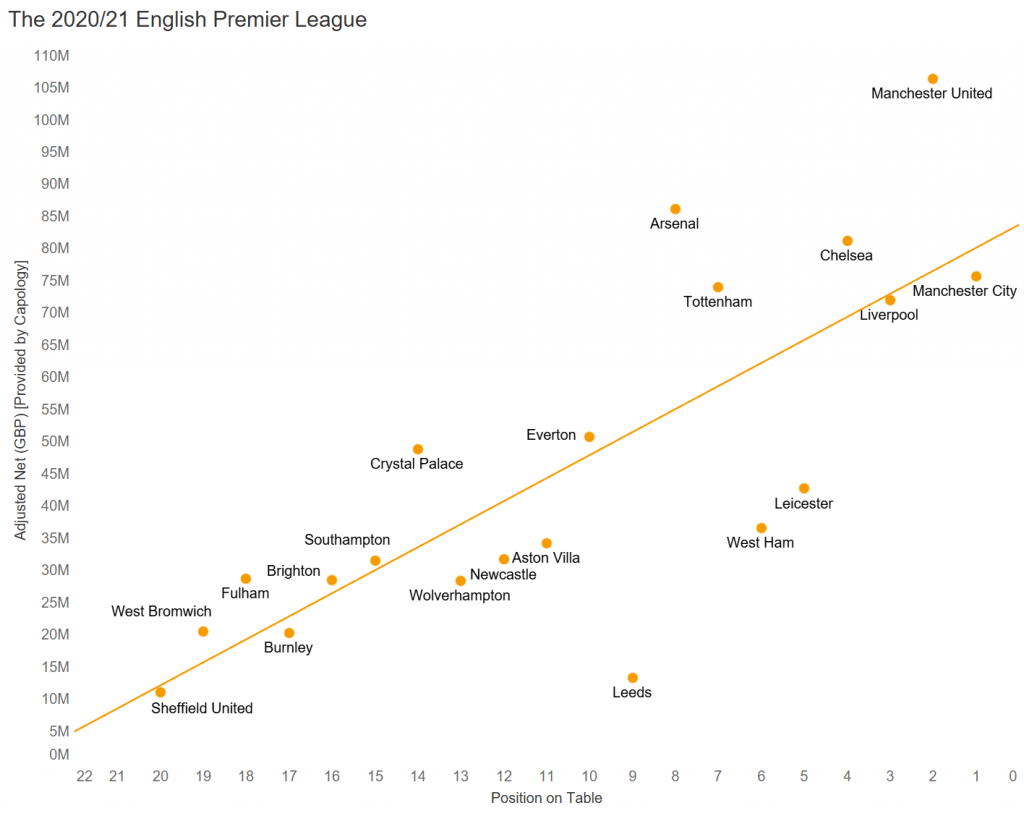
The immediate difference here is the increased financial disparity. In 2013/14, the financial gap between 17th and 5th was only roughly £11m. If we look at 2020/21—at a time where the market was depressed due to the coronavirus pandemic—we see the financial gap between the same two positions on the table as roughly £22m or double what it was just six seasons prior.
In addition to this, the 5th-placed team in 2020/21 (Leicester City) serves as a positive outlier for finishing in a position higher than what would be expected. If we replace Leicester with the side that reasonably should have finished in 5th, which would be perhaps Liverpool or Tottenham, then our financial gap would explode to £53m.
The slideshow below shows how the Premier League has evolved to only allowing marginal overperformances, with Leeds United (2020/21) and Sheffield United (2019/20) serving as the largest outliers with their 9th place finishes in the last two season, although one might question the sustainability of these performances given Sheffield United’s relegation in the following season and Leeds United’s struggles in the 2021/22 season:
Looking Outside of England
Compared to the Premier League, the financial differences among the remaining four elite leagues (La Liga, Bundesliga, Serie A, and Ligue 1) is not as noticeable. Of course, the super clubs still exist in these leagues and their status is reflected in their payroll.
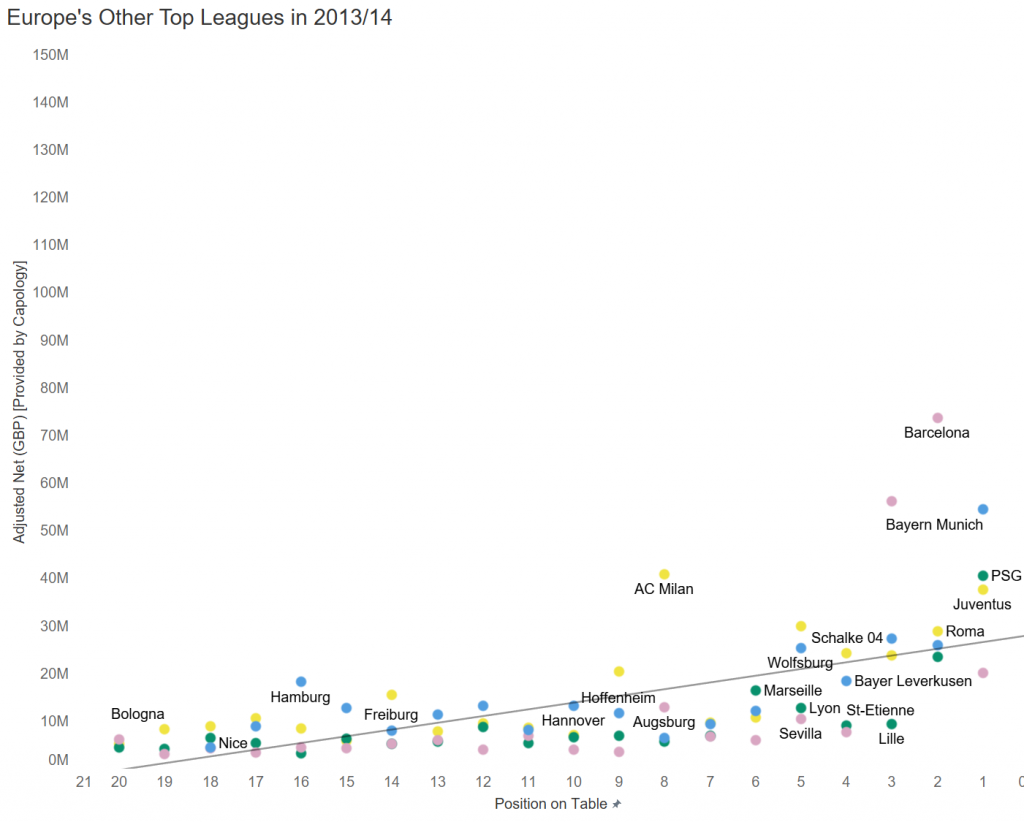
To begin with, we can return to view the landscape in 2013/14:

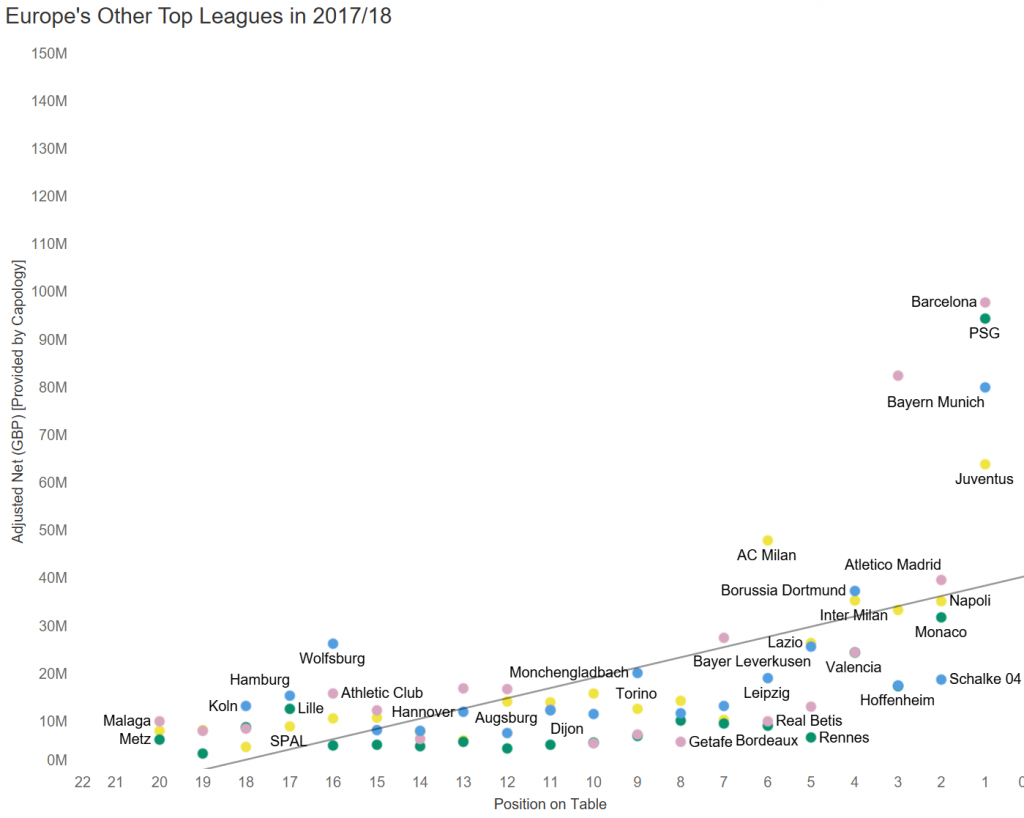
Due to the increased number of teams, as well as the lower levels of financial disparity, we can only highlight the outliers in figure 4 to keep the visual readable.
The 2013/14 season saw Atletico Madrid win the La Liga title by just three points with a much lower payroll than their rivals Barcelona and Real Madrid, who drew level on the table for second (Barcelona took second place thanks to a +1 goal differential).
We also saw the struggles of Hamburg result in an underwhelming 16th place finish, only surviving through winning the playoff, despite having a payroll that would have justified a place in the upper half of the table. That season, AC Milan can be classified as the biggest underachiever in the visualisation.
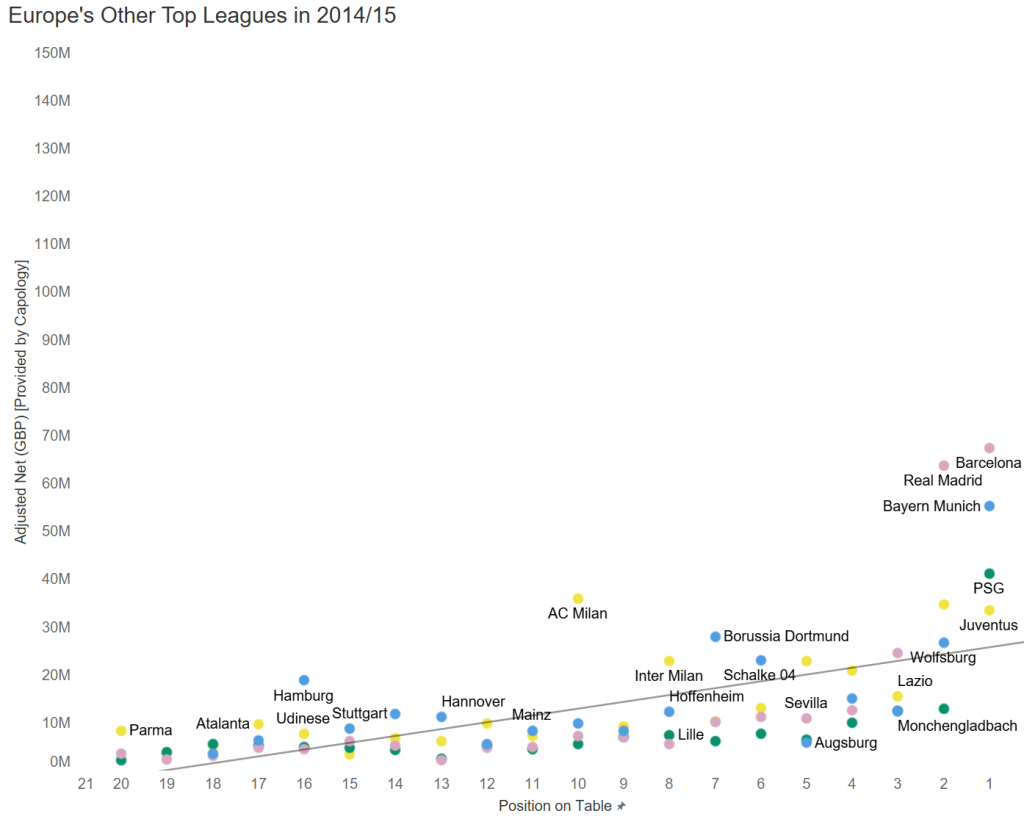
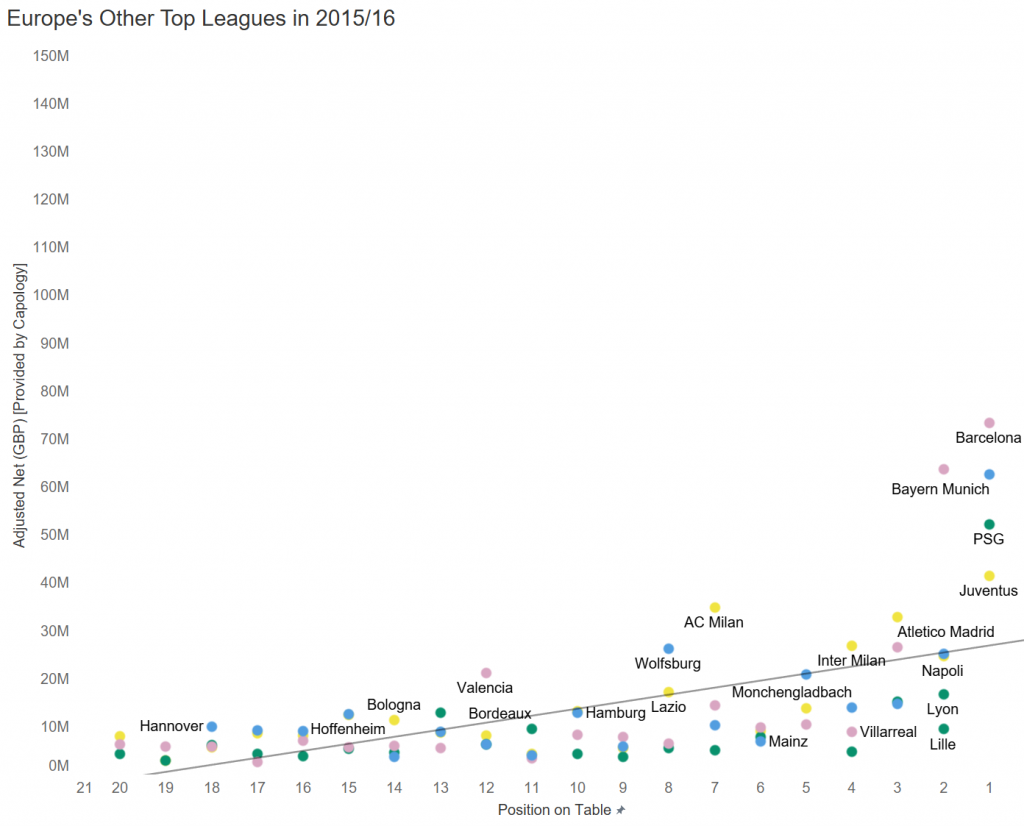
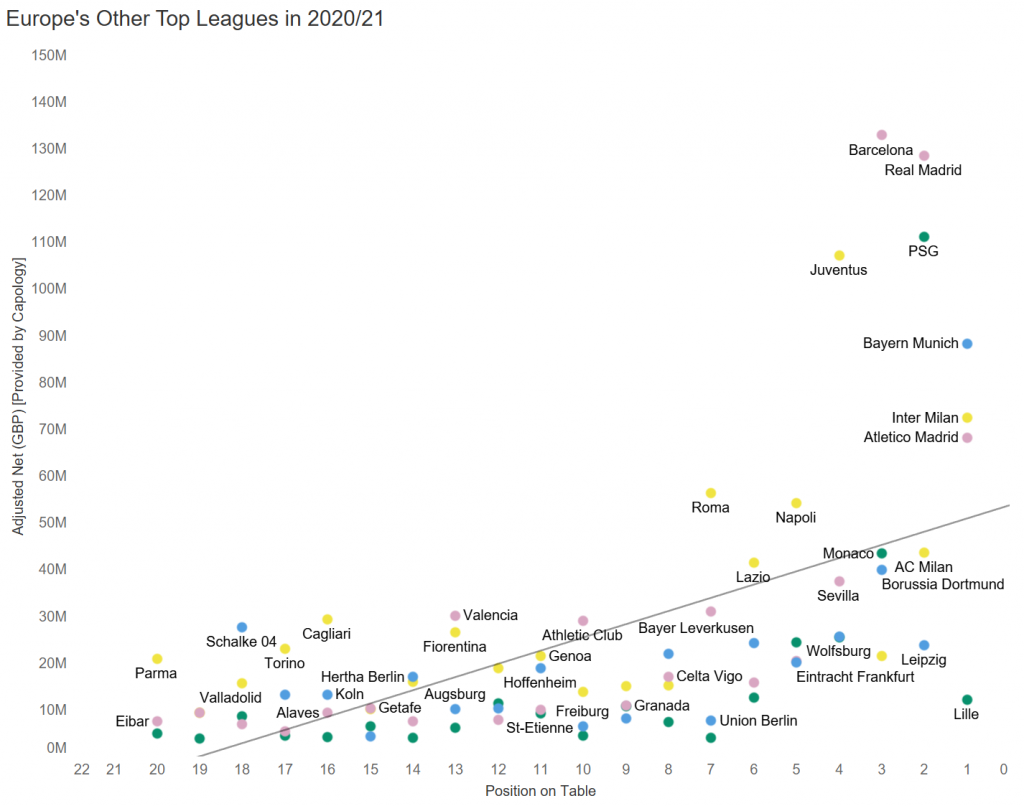
Now, how have Europe’s premier competitions evolved? What is the landscape of today?

When we look at the 2020/21 season, we can truly see the explosion in the budget for the super clubs, with Barcelona and Real Madrid almost doubling their player payroll over the course of a few seasons.
Perhaps what becomes more apparent is the strong showings of Lille, RB Leipzig, and Atalanta. These clubs have demonstrated the ability to execute a clear strategy that has not only shown immediate results but allowed for long-term sustainability, giving the romantics of football hope.
The Outliers
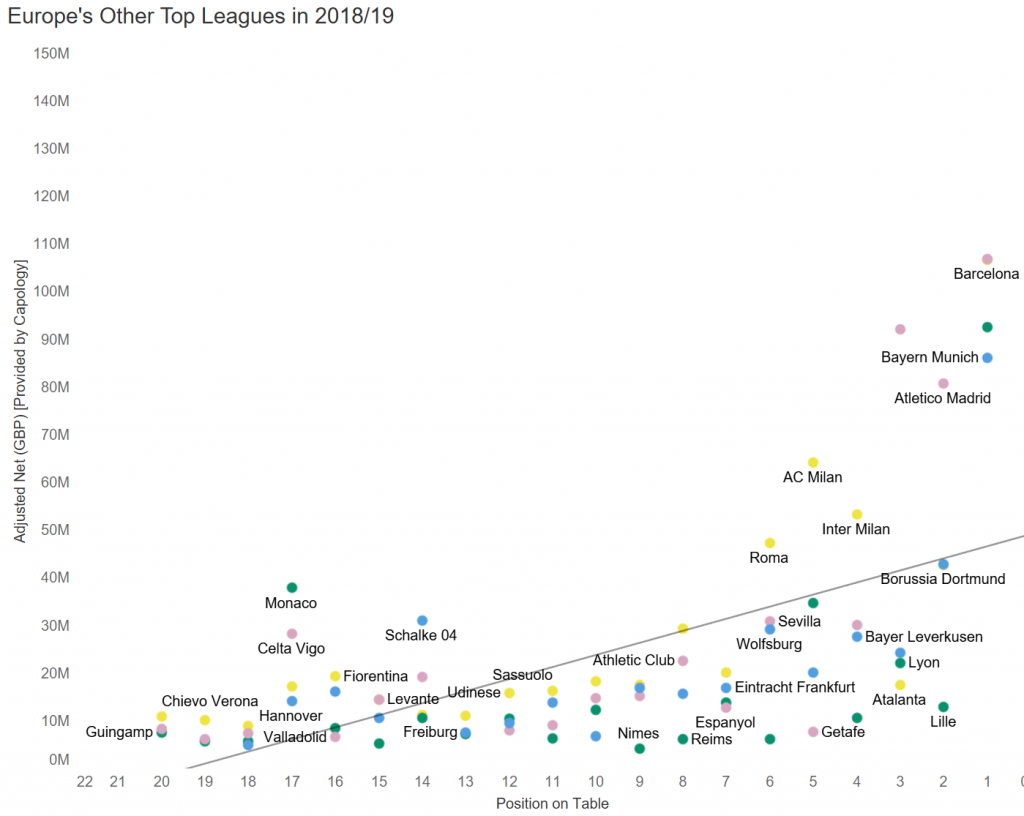
Let’s take a closer look at some of these outlier clubs. Here is a time-series slideshow of the other top five European clubs beyond the Premier League:
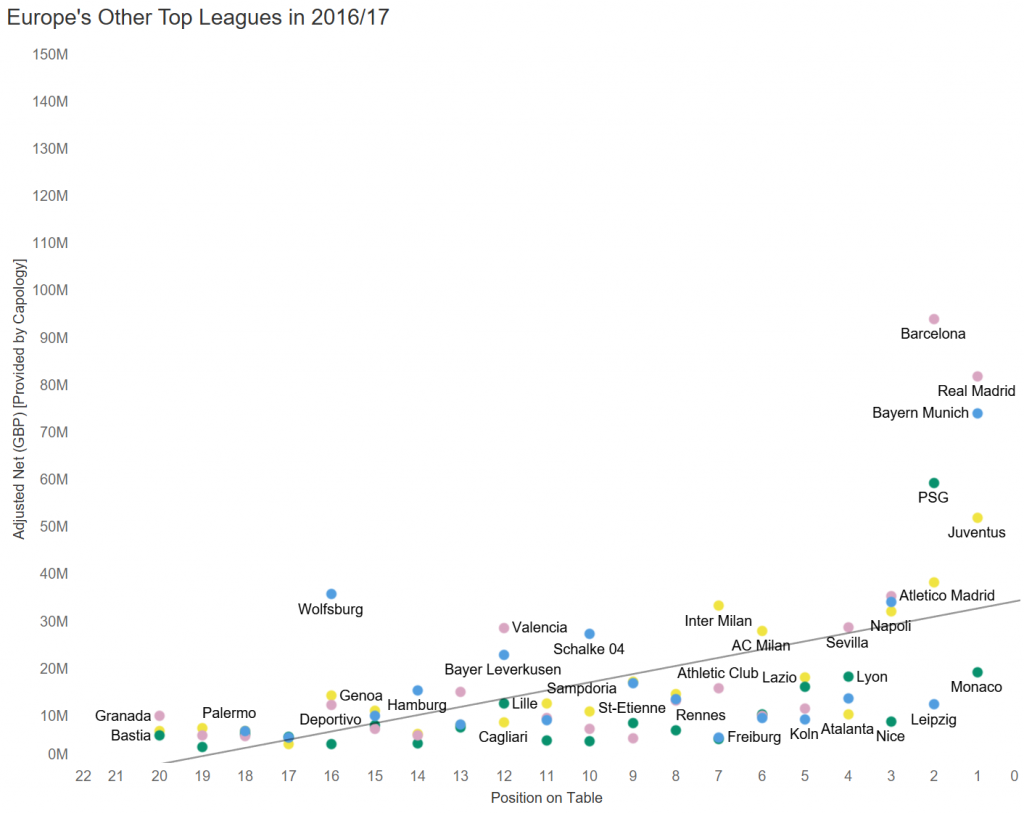
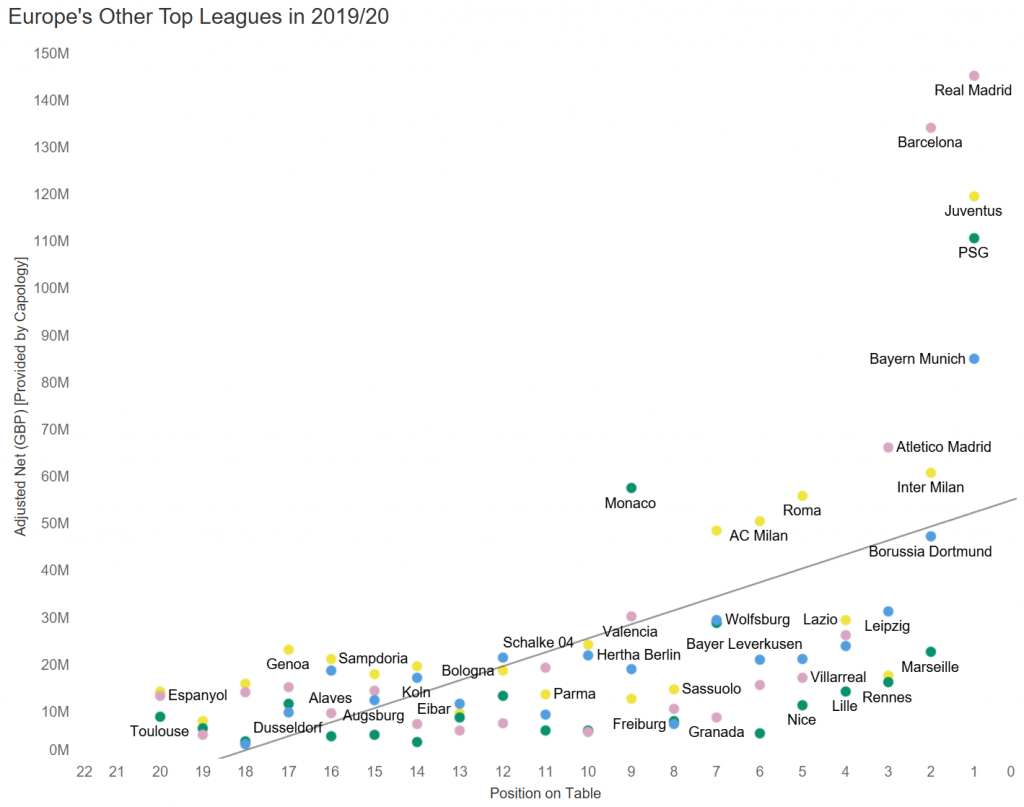
Atalanta’s emergence as an overachieving beloved underdog started really in 2016-17 when the club had the 13th largest payroll but managed a 4th place finish. The performance slightly fell in the following campaign: Atalanta held the 14th largest payroll but managed a 7th place finish. In the two most recently completed campaigns, Atalanta have managed a pair of 3rd place finishes despite it being completely reasonable for the club to finish 11th and 10th, respectively.
In RB Leipzig’s time in the Bundesliga, the Red Bull premier club has had an average expected finish of 6th but have found themselves finishing an average 3rd place on the table.
Looking towards France, we see the crown-stealers Lille having far more mixed results compared to our aforementioned clubs, largely due to the transfer frenzy that tends to follow their success. In the eight seasons in our data set, Lille have found themselves overperforming in six. However, they have only improved once, going from fourth in 2019-20 to first in 2020-21. In Lille’s case, overperformance is very possible but perhaps their methods should be deemed unsustainable?
Where is Football Headed?
At the beginning of this article, we referenced Major League Baseball’s data revolution and noted how the influence of data-minded staff has led to more financial parity throughout the elite leagues. In the course of this article, the data for the top five European leagues between 2013/14 and 2020/21, we can see how the rich have grown richer and the financial correlation to success has perhaps become even tighter than before, despite football becoming inherently smarter.
Outliers can always happen, of course; that is the beauty of football. The question to consider is this: “Will football ever reach the level of Major League Baseball in the sense of funding not being a guaranteed correlation of success, or will the rich continue to grow richer and further secure their dominance?”
Of course, the key difference between football and the American model of sport is the ability to gamble on youth. In American sport, there is not the looming threat of relegation or the fear of the largest bidder easily poaching a youngster turned star.
There are also protections in place that allow a fostering of youth in the franchise system. If a player is becoming a star, a rival franchise must either wait a certain amount of time before being able to make an offer through free agency, or they must trade their assets.
With on-field performance, teams can afford to finish lower in the table due to the reward of a high draft pick to better their chances of bringing an elite younger talent to the team. This also offers a level of competitive balancing within the American model of sport.
Football has shown that it is possible to find a performance above expected through ideal squad building or striking a golden generation of youth, but the likelihood is that the free market of football will quickly lead to successful smaller teams seeing their carefully-crafted squad broken up at the hands of the super clubs. Only time will tell if the outlier approach is to become a reliable option in the pathway to success or if the dominant clubs of the world will strengthen their iron fist.
Header image copyright IMAGO/Mary Evans