Josh Hobbs explores the idea of “attacking balance” and takes a look at how teams in the Premier League fare by that measure.
“They’re a one-man team.”
“If those two got injured at the same time, they’d have nothing going forward.”
These are common criticisms that crop up all the time in casual football conversations.
It’s easy to see one player carrying a lot of responsibility in their team and presume that says something negative about the rest of the team. But is it really a valid criticism? Does being reliant on a few star players to provide attacking threat really make a team bad? Isn’t it better to have a few players that move the ball forwards and create chances than a lot of players that don’t do that very well?
Recently, Omar from @topimpacat shared a thread on Twitter on this topic, breaking down Premier League teams’ ball progression and chance creation to show which teams spread their contributions amongst the squad and which rely on a small number of players.
Here is an updated version of the graphic which he made, which Omar has kindly shared with us in order for us to delve further into the topic in this article:

In the rest of this piece, we’ll dig a little bit beneath the surface to explore this notion of ‘attacking balance’ and see what we can learn from it.
Creating and Receiving Passing Value
Looking first at the graph on the left, we can see how each Premier League team spreads the playing and receiving of ‘progressive value’ around their players.
‘Progressive value’ is a score given to each pass which compares the probability of a goal being scored at the start point of a pass and at the end point of a pass. If the value is positive, the pass has increased the likelihood of a goal being scored. Negative values, though, indicate that a pass has decreased the likelihood of scoring.
The bottom left-quadrant of the graph shows teams whose playing and receiving of progressive passing value comes from the fewest number of players, whilst the top right quadrant features teams who spread out the responsibility for progressive value in both cases.
Teams with Less Attacking Balance
Looking at teams with less attacking balance, Aston Villa and Burnley are the notable teams.
It should come as no surprise that Villa rely heavily on Jack Grealish and Ollie Watkins to progress the ball:
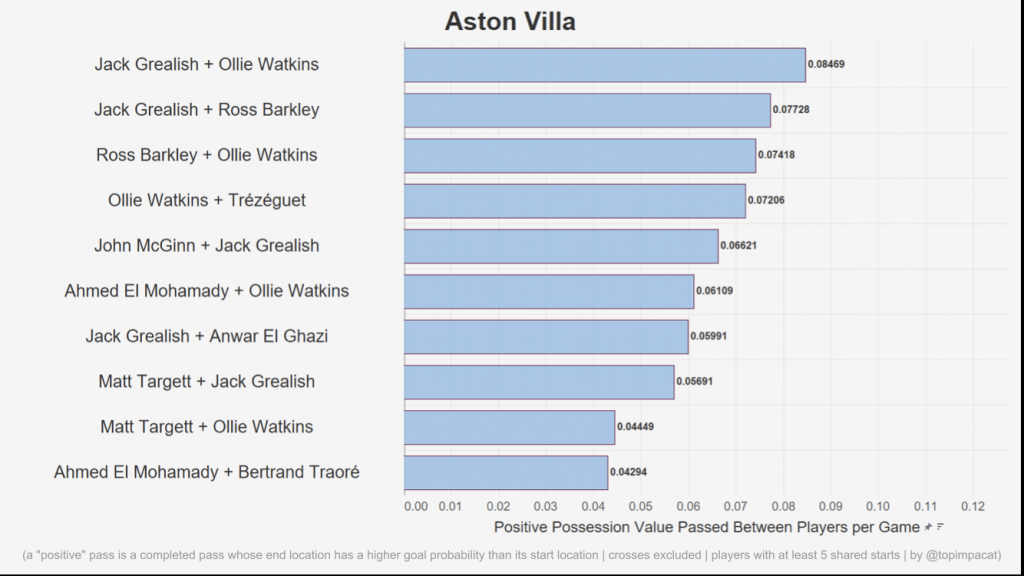
On the pitch, this plays out by Ollie Watkins stretching defences and making a lot of runs in behind to receive passes in the channels and balls over the top coming from deep. Grealish is the man Villa look for at every opportunity as he carries the ball forwards to dangerous areas from which he will play aggressive passes.
As you can see from Grealish’s TransferLab profile, he was exceptional in his wide playmaker role this season:

His progressive short passing ranked him in the 100th percentile for position, so TransferLab’s metrics tie up nicely with the graph above. Villa were reliant on Grealish and Watkins for their progression but this isn’t a bad thing, given their quality.
The colour and size of the marker shows that, although they sit in the bottom left-quadrant of the graph, Villa put up a decent overall value for PV. This is the first suggestion that a team who don’t share the load for ball progression doesn’t necessarily equate to a team that is bad at ball progression.
It has to be noted that Villa struggled badly when Grealish was injured and they seem to be prioritising players that can help them progress the ball and create alongside—or perhaps more likely in the absence of—Grealish. With Emilano Buendia already signed, several bids going in for Emile Smith Rowe and James Ward-Prowse another target, perhaps Villa will move a little more towards the centre on a future version of this graph?
Burnley are also a team who are heavily reliant on certain players:
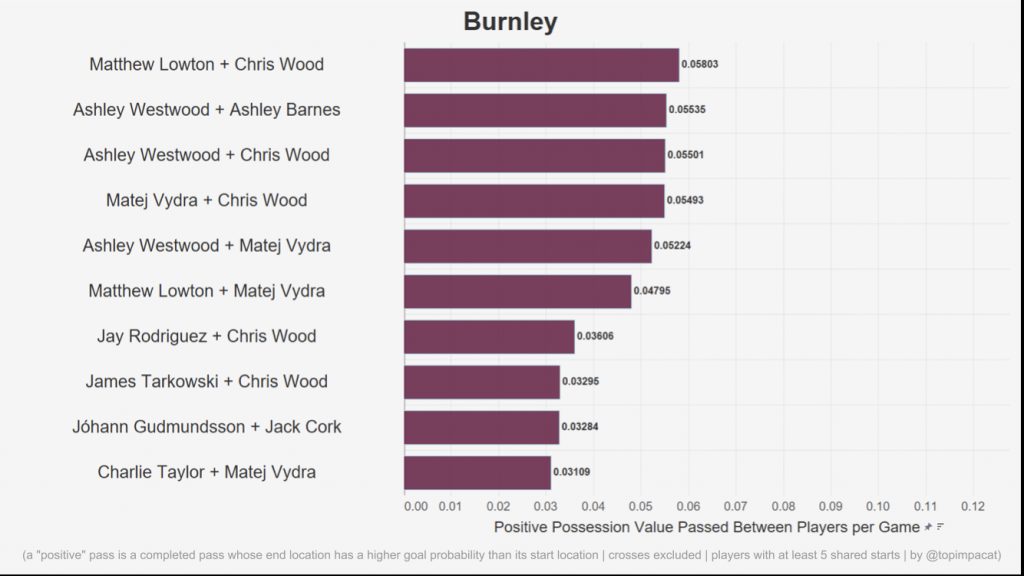
As they are one of the league’s most direct teams, Chris Wood is the focal point to receive progressive passes. As you can see in his TransferLab profile, he ranks in the 97th percentile for forward passes received:

The New Zealand international is excellent at engaging defenders, occupying the last line and providing his team with an option to pass to high up the pitch. He is rounded enough as a forward that he is able to receive the ball with his back to goal and can also run behind, although he doesn’t have the pace to be a top level threat in that sense. In the second half of the 20/21 season, Sean Dyche began to use a front two of Wood and Matej Vydra with Wood often flicking the ball on for Vydra to provide the penetration in behind.
Despite this, though, Burnley are one of the least impressive teams in terms of possession-value accrued. They are a better example of a team who rely heavily on individuals in a way which is impacting them overall in a negative sense.
Teams with More Attacking Balance
Unsurprisingly, Manchester City put up the highest overall PV value and they appear in the top-right corner where they spread responsibility throughout multiple players.
This is to be expected given the quality of their squad. Players who sit on the bench for City would be star players for most of the league. Burnley obviously have a budget a tiny fraction of their Lancastrian neighbours so it’s hardly surprising that they are poles apart on this graph.
A team with a more comparable budget to Manchester City are their closest rivals, Manchester United. Interestingly, they find themselves in the top left quadrant, meaning they have multiple players receiving progressive passes but they are the third most reliant on few players to progress the ball.
Looking at the breakdown, it becomes obvious why:
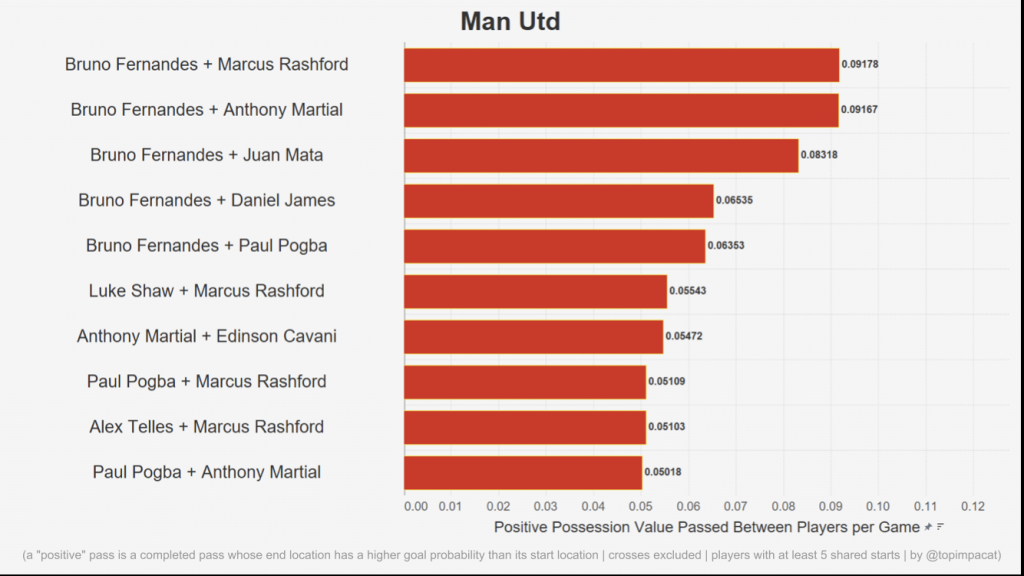
Of course, it will come as no surprise to Premier League fans that Bruno Fernandes is an important creator. But it’s important to note that Fernandes is central to Manchester United’s creativity because Ole Gunnar Solskjaer almost never rotated him, despite having signed Donny Van De Beek. This could be used as evidence for the theory that Solsjkaer relies on individuals too much for his team to function.
Creating and Taking Goal-Scoring Chances
The graph on the right of the image shows the creation of specifically goal-scoring chances: the x-axis being the percentage of a team’s expected assists (xA) by player and the y-axis being the percentage of a team’s expected goals (xG) per player. Once again, the bottom left quadrant contains teams reliant on few players for both metrics and the top right contains teams which spread the load.
Teams with More Attacking Balance
Perhaps surprisingly, Sheffield United are one of the most balanced teams in both graphs. That said, they’re also putting up the second worst overall PV and the worst xG.
Their clever tactical system of overloading the wings—which they played for a long time under Chris Wilder and largely continued under caretaker manager, Paul Heckingbottom—helps a few players contribute to creating chances. Ultimately, though, the Blades were missing a player to really carry the burden to score and create.
David McGoldrick did his best, sitting in the 59th percentile for xG and 40th for xA, but ultimately it was nowhere near enough as Sheffield United were relegated rock bottom:

Interestingly, Newcastle and Brighton are also both in the top right for both graphs. Brighton’s overall values are higher with Brighton producing a non-penalty xG of 51.6 compared to Newcastle’s 41. However, Newcastle had more individual quality when it came to taking those chances through Joe Willock and Callum Wilson.
Here is Willock’s TransferLab profile as a box to box midfielder:

As you can see, Willock ranked in the 98th percentile for expected goals for midfielders. Importantly for Newcastle, he backed that up with his finishing ability and ended the season with 8 Premier League goals from midfield.
Brighton, on the other hand, had Neal Maupay on the end of the majority of their chances. He did score 8 goals but this is a lot less impressive given that he was Brighton’s main goal threat and he underachieved his expected goals by more than 4 goals.
His TransferLab profile shows that he was in the 88th percentile for xG but only the 28th percentile for finishing:

This was ultimately the story of Brighton’s season. Although their progression and attack functioned very well, the finishing ability of many of their players let them down. Brighton’s attack was undoubtedly more functional than Newcastle’s, but in the end, the Geordies outscored the Seagulls by 6 goals. This is all the more remarkable given the difference in expected goals.
Arsenal are an example of what a team with better individual players can look like as they are in the top right for both graphs and they perform solidly for overall PV and xG:
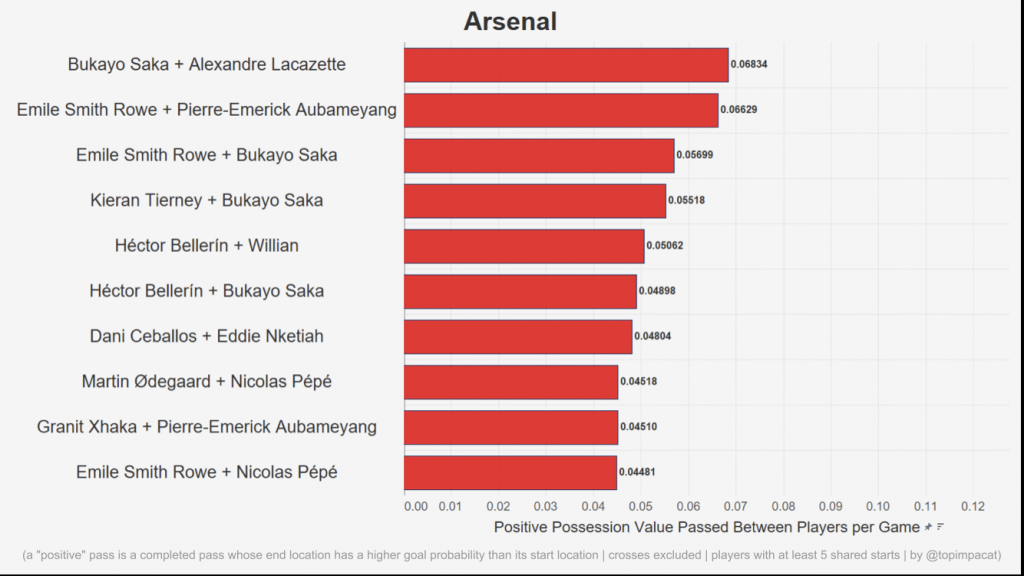
They could still do with somebody stepping up in the creator and goal-scoring roles to take them to the next level though as they are 9th in the league for xG. Perhaps they’d be better overall as a team even if they shifted towards the bottom left on the graphs?
Teams with Less Attacking Balance
Taking a look at the bottom right quadrant, West Ham stand out. They have a good overall xG total, ranking 8th for this metric. There are a number of different creators in the team: Aaron Cresswell, Vladimir Coufal, Said Benrahma and Pablo Fornals their top creators.
However, Michail Antonio and Thomas Soucek stand a long way clear of the rest of the team when it comes to being on the end of chances. Antonio ranks in the 98th percentile for open play xG compared to all strikers in the Premier League. Looking at his heatmap, there is significant activity in the six-yard box, which is where the striker scores the majority of his goals from:

In the bottom left of the graph, it’s impossible to ignore Tottenham Hotspur. Spurs’ attack was almost entirely carried by the combined exploits of Son Heung-min—who started the season on an incredible hot streak of finishing, scoring 17 goals from 9.5 xG—and Harry Kane.
The latter had one of his finest ever seasons, winning the awards for most goals and most assists. This output was backed up by Kane’s underlying numbers with his TransferLab profile placing him above the 90th percentile for expected goals and assists:

With Kane and Son firing, Spurs ended up as the fifth top scorers in the league. However, if one of Kane or Son had gone cold, they would have really struggled for goals. When Son was in the midst of his hot streak, Spurs were being talked up as title challengers, but as his finishing regressed towards the mean, Spurs tumbled down the table and ultimately finished 7th.
New manager, Nuno Espirito Santo had tended to utilise the talents of a few players in creating and goal-scoring at Wolves, so it’s likely that he would look to focus on Kane and Son and giving them the best support possible next season. This presumes that Harry Kane isn’t sold to Manchester City, of course. If they were to sell their captain then Spurs would need a complete attacking overhaul.
Also in the bottom left of the graph are Leeds and Liverpool. In fact, both take up similar positions in the progression and creation graphs. These teams have very functional attacks, even if they rely on a core group to progress, create and score. Liverpool rank second for xG, behind Manchester City, whilst Leeds were fifth, which was remarkable for a newly-promoted side.
Liverpool were heavily reliant on the front three when it came to getting on the end of chances:
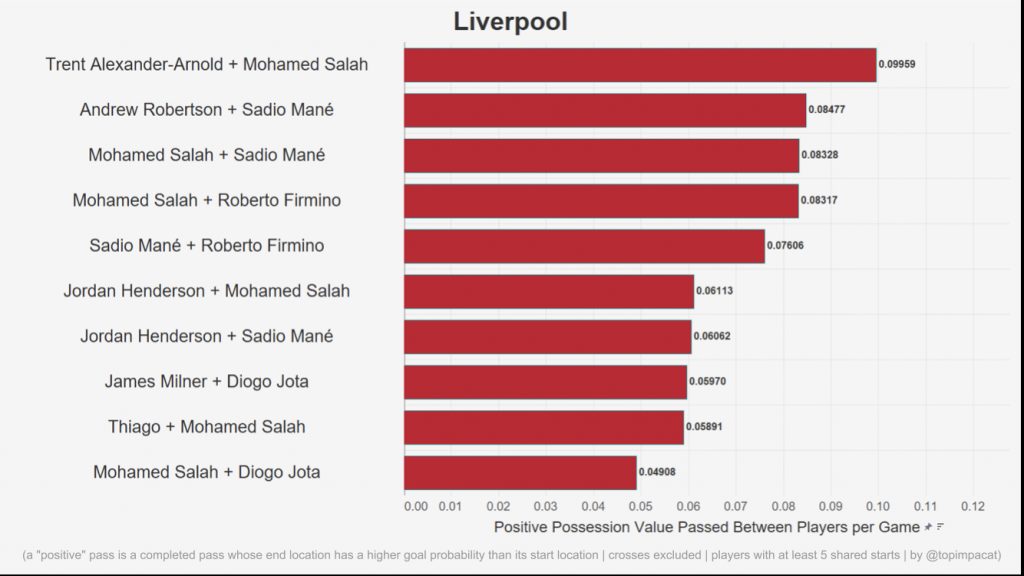
Mane had a poor season by his standards in terms of finishing but his xG was still high, whilst Mohamed Salah was exceptional again. Although these players carried a lot of the load, they are elite and play a lot of minutes. This might explain why the chances not being spread out amongst any of their backups, for example.
If Mane’s finishing had been at the level that it had been in the previous season, perhaps Liverpool would have challenged Manchester City a lot more closely, given that their chance creation was at a similar level as it had been in the previous season, when they won the league at a canter.
Regarding chance creation, though, they were a little more diverse. Trent Alexander-Arnold and Andrew Robertson put up the best creative numbers in the team, which alongside the contribution of the front three, makes Liverpool look pretty strong overall.
Leeds had key players in a few different positions who performed important roles in progression, chance creation and scoring. Luke Ayling was the key ball progressor from right back as he would carry and pass the ball up the line, whilst Kalvin Phillips was required to try to move the ball forwards when he could from his single pivot role in defensive midfield. The England international ranks in the 88th percentile for progressive long passing on TransferLab for the 20/21 season.
Raphinha, though, was the primary source of chance creation in the team and his ability to dribble into the right half-space and create from there make him a real weapon for Leeds:
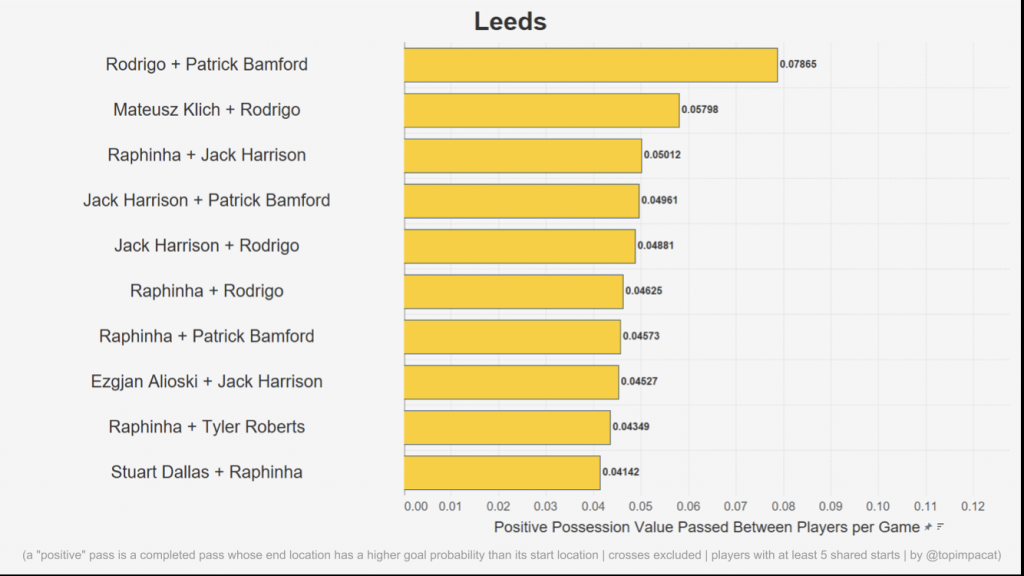
As you can see in his TransferLab profile, the Brazillian ranked in the high 90th percentile and above for key passes, progressive short passing and dribbles as well as the 88th percentile for progressive passes received:

Alongside Raphinha, Jack Harrison was a regular source of chance creation with his crossing from the left-flank and Leeds had Patrick Bamford to get on the end of chances. He ended the season on 17 goals and had the third highest non-penalty xG in the league behind Kane and Salah.
The key with Leeds and Liverpool is that they are both excellently-coached units with every member of the team performing important tactical roles in possession, whether they contribute a lot towards progression and attacking play. Burnley feature in the same sector as Leeds and Liverpool in both graphs but it’s hard to say the same things about their play with the ball, hence their very low total scores for PV and xG.
Conclusion
What do we learn from all this?
The most important conclusion is that attacking balance does not necessarily indicate a “better” or “worse” team. A team who rely on a couple of players for goal creation are just as likely to be functional as a team who share around the responsibility.
Of course, everybody would love to be like Manchester City with a squad full of elite players able to play multiple roles, move the ball up the field efficiently and finish the season with seven players scoring over five goals with two breaking double figures. But that is a luxury that not everyone can enjoy.
Equally, no club wants to be so heavily reliant on one or two players that injuries can derail their season. The danger here is one of risk: if your most productive player were to get injured, there is no saying that you might be able to maintain the same level. Aston Villa without Jack Grealish are the case in point here.
Again, the issue here is financial. For smaller clubs, this risk is one that they can hardly afford to avoid. For them, the goal is to bring in a couple of elite players who can push their level up for a season, benefit financially, and slowly build the profile of their squad. But this is not always possible.
Does that matter? Well, to take the example of Sheffield United, yes and no. On the one hand, the Blades were able to survive a season in the Premier League without overly-relying on star players. But when the productivity of their system dropped off, they were unable to turn things around. Perhaps bringing in a more elite player might have helped, as Joe Willock’s loan did for Newcastle.
Attacking balance, then, is something that clubs should consider when weighing up their risks going into a season. As we have said, there is no right or wrong approach when it comes to attacking balance. The problems arise when your attacking system suffers a drop in productivity. Being aware of the risks inherent to your system will only benefit a team as the go into a new season.
Analytics FC provides software and data services to entities within football looking to realise the gains possible from analytical thinking. We provide cutting-edge software solutions such as TransferLab, which helps improve and simplify recruitment decisions. To find out more about TransferLab and our other data services, or to find out more about us, visit our website.
Header image copyright IMAGO / PRiME Media Images