Aditya Kothari looks at the ways tracking data can be used to quantify defending more effectively.
The most commonly available data today are events data, and more specifically, on-ball data. When it comes to off-ball events, the kind of data available from a defensive point of view are tackles, interceptions, and in some cases pressures.
This presents a very restricted view of defending since much of the art of defending involves off-ball activity: holding a good position to prevent a pass or a shot, steering players away from dangerous positions, and so on. By the definition of event data, the aforementioned actions are not captured in the event data.
With the increasing availability of tracking data, which records the coordinates of all the players and the ball at each point of the game, it may be possible to address this shortcoming. In this piece, I am going to explore some of the avenues that open up with the availability of tracking data to quantify defending.
Methodology
If we simplify the actions of the attacking team, they can be boiled down to three primary types: passes, carries and shots. We can further reduce this list to two by simplifying a carry as a collection of short passes to oneself.
The role of a defender, therefore, is to prevent these two actions: passes and shots. If we can quantify the extent to which a defender is able to prevent passes and shots—beyond their on-ball actions like tackles and interceptions—then we may be able to get a good idea of their off-ball defensive contribution.
Pass Prevention:
To calculate pass prevention, we can build upon two existing frameworks: pitch control models and possession value models.
Pitch control models generate the probabilities of each player controlling a ball at any point on the pitch from a given situation. They use the location and speeds of the players along with the location of the ball to derive a probability based on how long it will take for the ball to reach a particular point on the pitch if it were passed there, how long it would take the player to change their direction and reach that same point, and how many other players could also be contesting for the ball.
In this figure, you can see what the output of a pitch control model looks like:
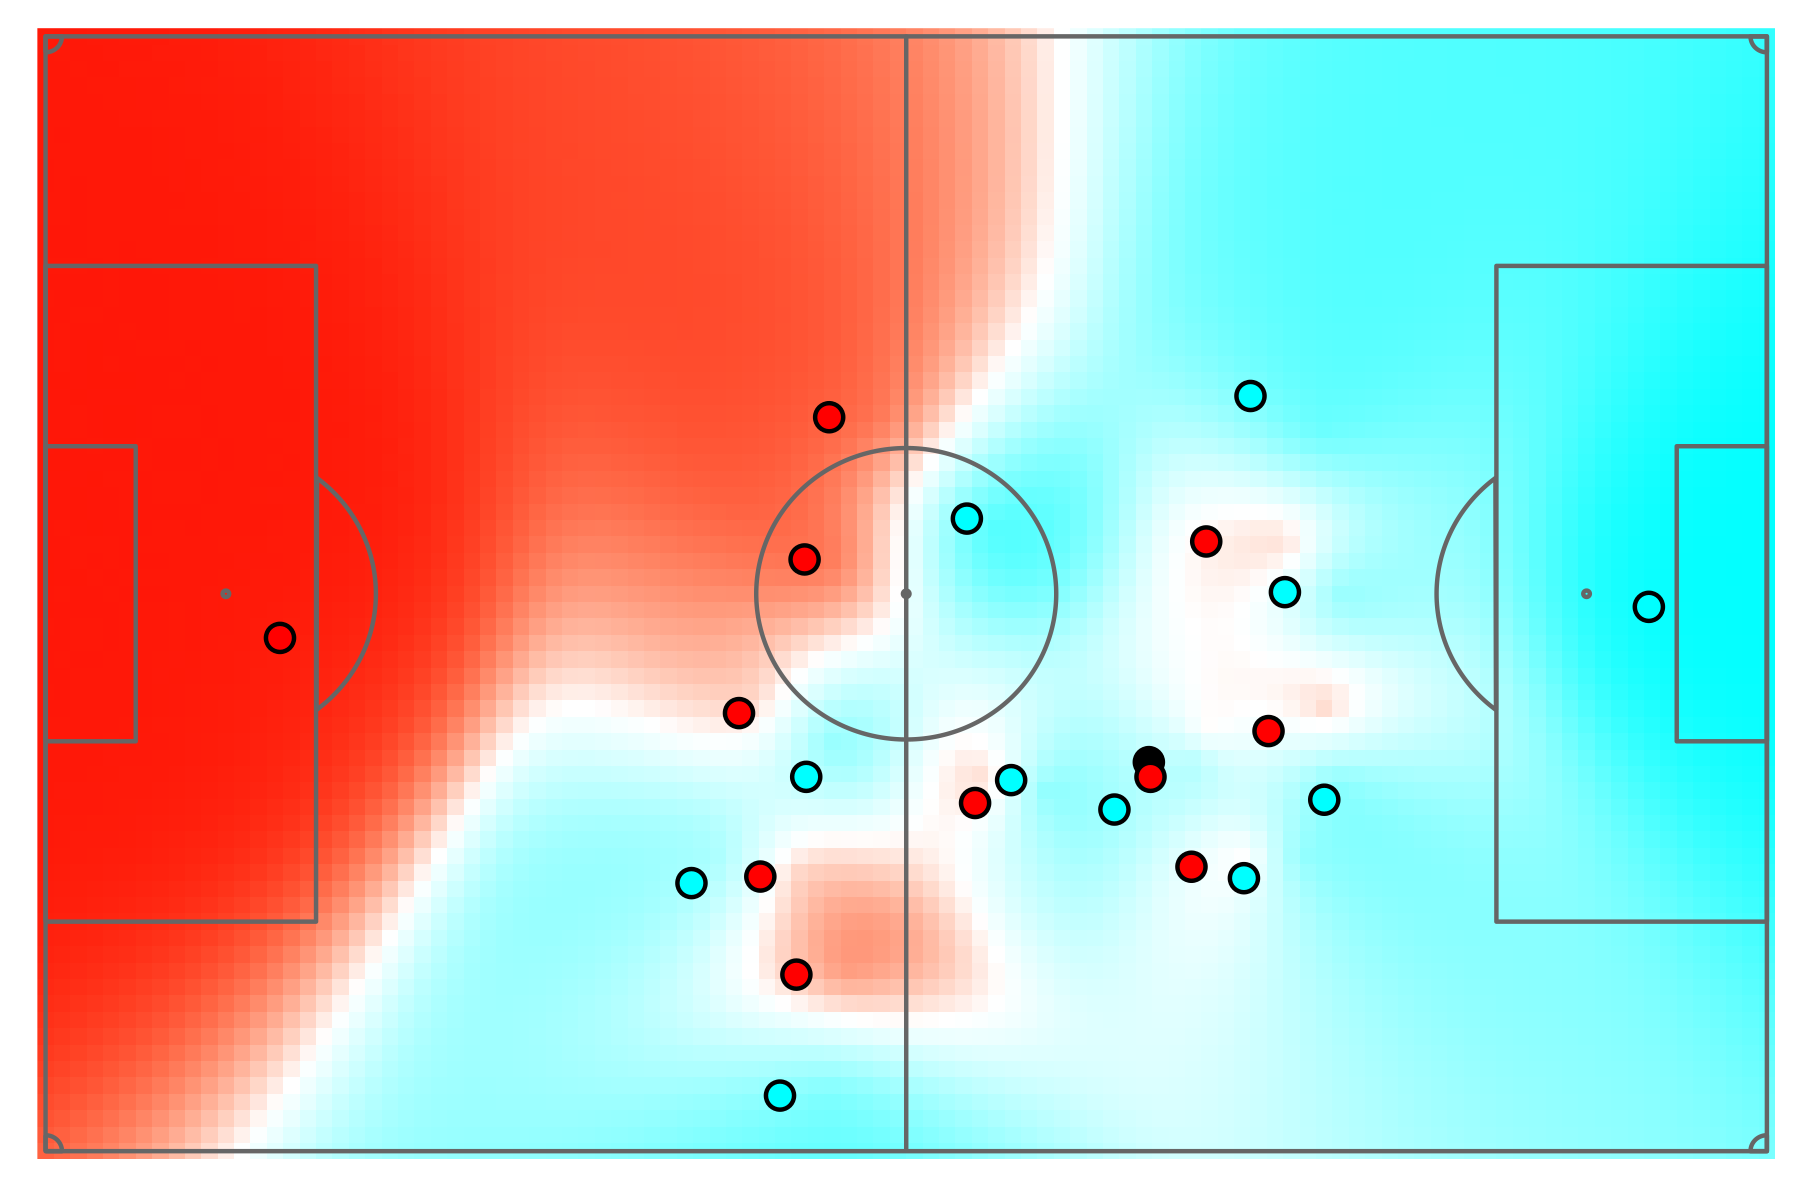
Notice how the ends of the pitch are pretty heavily controlled by the red and the blue team, respectively. In the middle of the pitch, the red team—the team in possession in this case—only has a couple of pockets of space where they have a similar or higher probability of controlling the ball to the blue team.
Using these kinds of pitch control models, we are able to assess how well a team is defending space. However, not all space is equal. There are some spaces that are more important to defend than others. To introduce this aspect of defending into our pass prevention model, we need to add another layer: a possession value model.
The general concept behind most possession value models is to estimate the probability of a team going on to score at the end of a play when they possess the ball in a particular location on the pitch. Areas much closer to the team’s own goal would have much lower possession value while areas closer to the opposition’s goal would have higher possession value. I use a very simple model which calculates the possession value as k/distance to goal where k is some reasonable constant.
We now have everything we need to build a pass prevention model.
Pass prevention is a measure of the interaction between a set of attacking players and defending players. Firstly, we create an intermediate metric called ‘pitch control value’—which is the sum of the pitch control of a player across different parts of the pitch—and weight it with the possession value of the part of the pitch.
We then calculate another set of pitch control probabilities and pitch control values for the attacking players by excluding one of the members of the defending team. You would expect this to be a higher value than the earlier calculation since there are fewer defending players included in the calculation. The ratio of the change in the pitch control value of the attacker upon the pitch control value of the attacker without the defender is the pass prevention metric.
The two figures on the top of this graphic show the pitch control for the red team’s right wing forward (RWF) with and without the blue team’s left back (LB). The figure on the bottom left shows the increase in the red right wing forward’s pitch control:
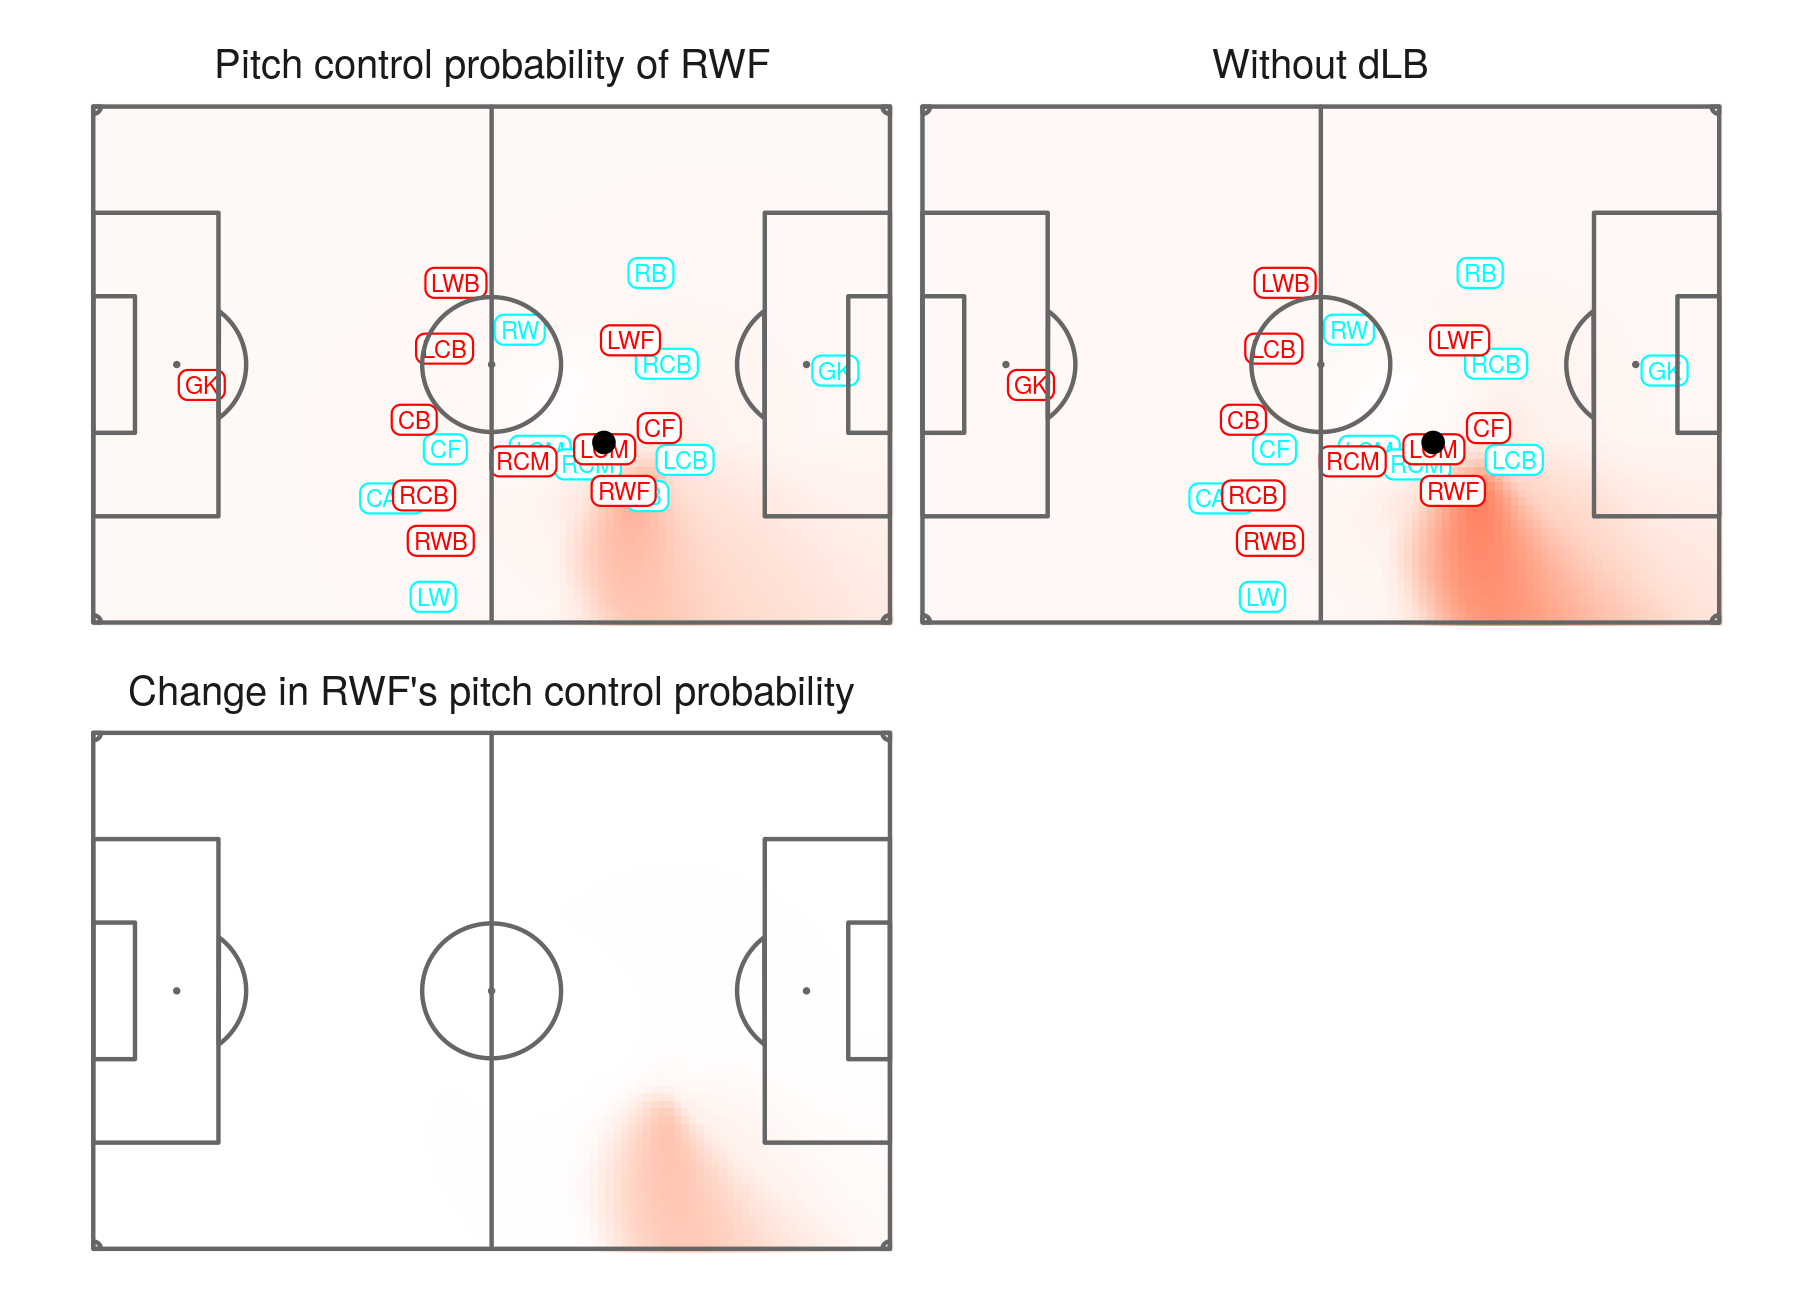
To calculate the pass prevention of the blue team’s left back on the red team’s right wing forward, we take the change in optimal pitch control for the right wing forward (the figure at the bottom of the graphic above) and divide it by the optimal pitch control of the right wing forward without the left back (the figure on the top right hand side of the graphic above). On top of this, both terms in the equation are weighted by the possession value model to reflect the attacking threat of the area of the pitch where the passes are being prevented. The resulting weighted ratio is the pass prevention of the LB on the RWF.
Shot Prevention:
Similar to pass prevention, shot prevention tries to quantify the impact of defenders on the opposition’s shooting.
At every point during a game, we can simulate a number of realistic shot trajectories from where the ball is at that instant. From here, we can then estimate which trajectories are likely to get blocked by any of the players on the pitch based on where the players are, their movement, whether they are a keeper or an outfield player, the reaction time they have, which team they belong to, and so on.
For each player, we can calculate their contribution to increasing the probability over all the simulated trajectories getting blocked. We can also estimate a probability of getting an on target shot from the current situation using historic shot data and scale down the blocking probability by the expected on target percent. This value is the shot prevention metric for that player.
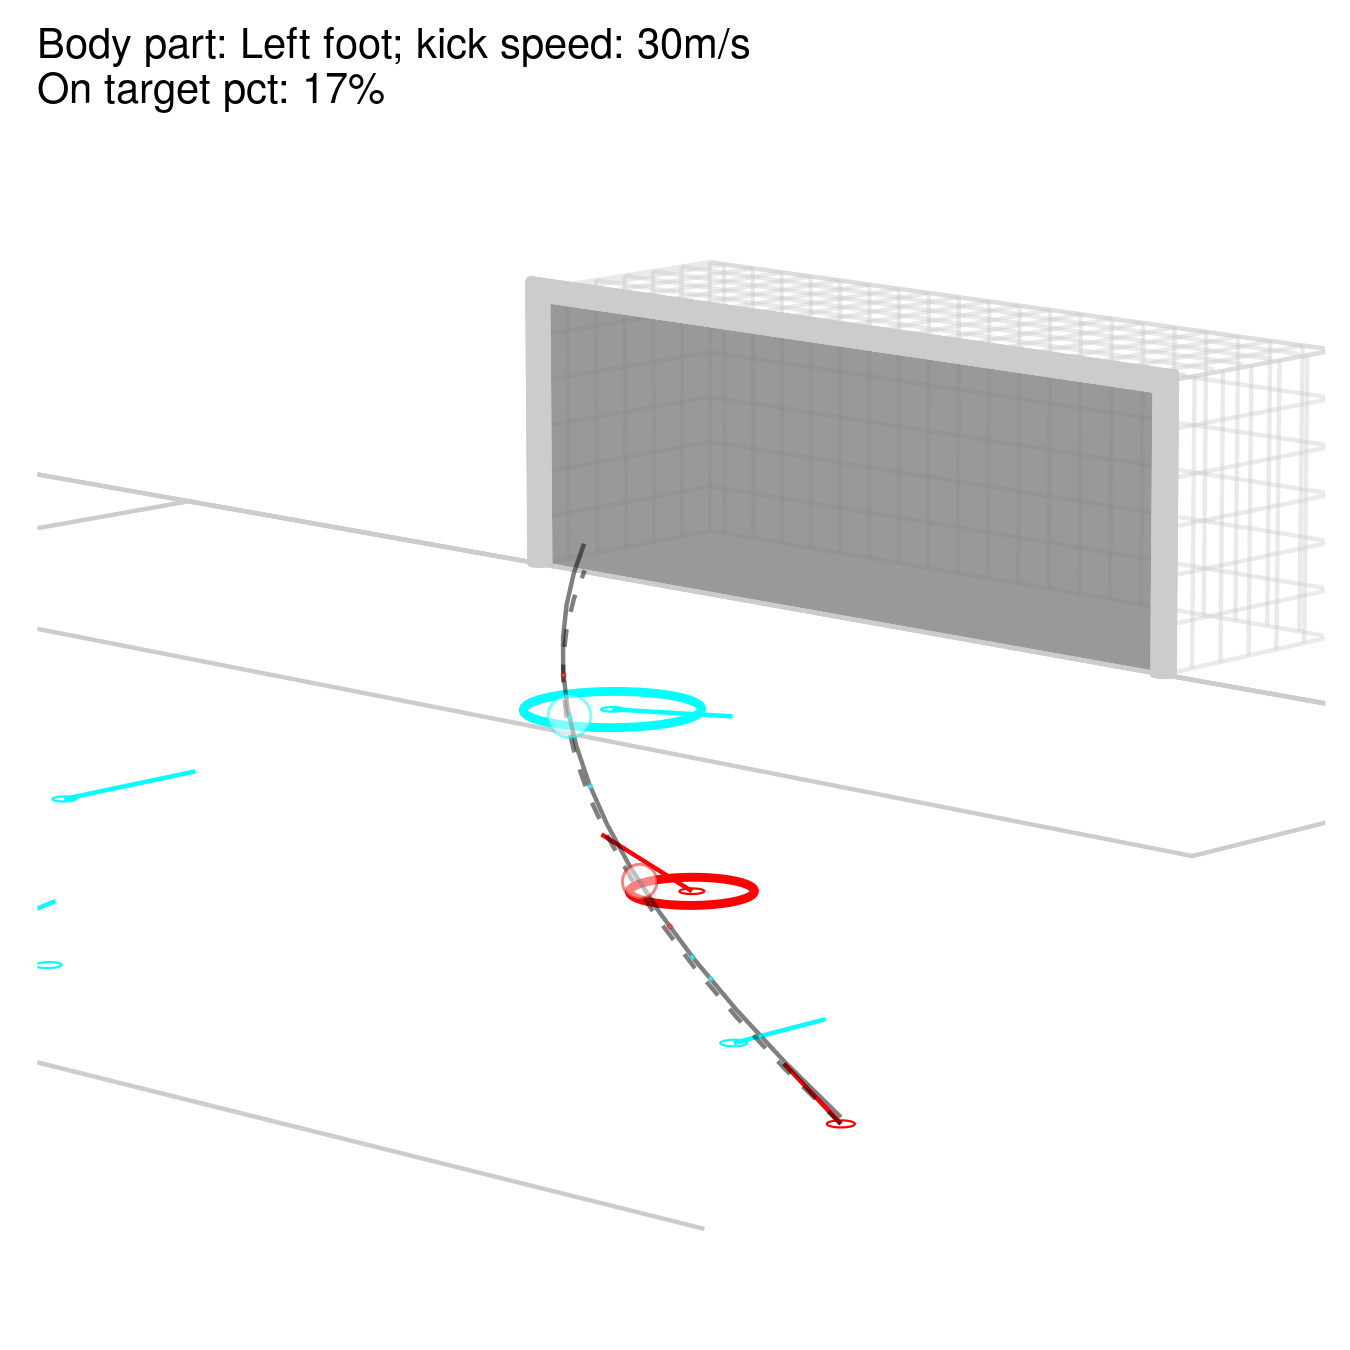
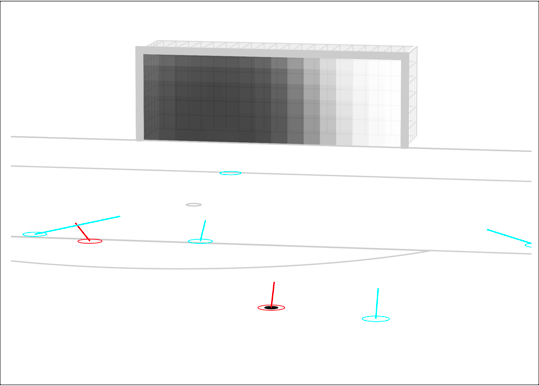
This figure shows one of the simulated trajectories from a frame where a player of the red team at the bottom of the figure has the ball, and is taking a shot which is curling into the far post. The other players on the pitch have some probability of blocking this shot trajectory, which is indicated by the size of the ring around their position on the pitch.
For instance, the blue team’s goalkeeper (GK) has quite a high probability of blocking the shot, another member of the red team could also possibly block the shot, while the blue team’s defender closest to the ball has very little probability of blocking this shot trajectory.
We can calculate the shot prevention metric by repeating the above process over many shot trajectories.
Putting the Models into Practice
Here is a clip which we can run through these two models and see the results:
Pass Prevention:
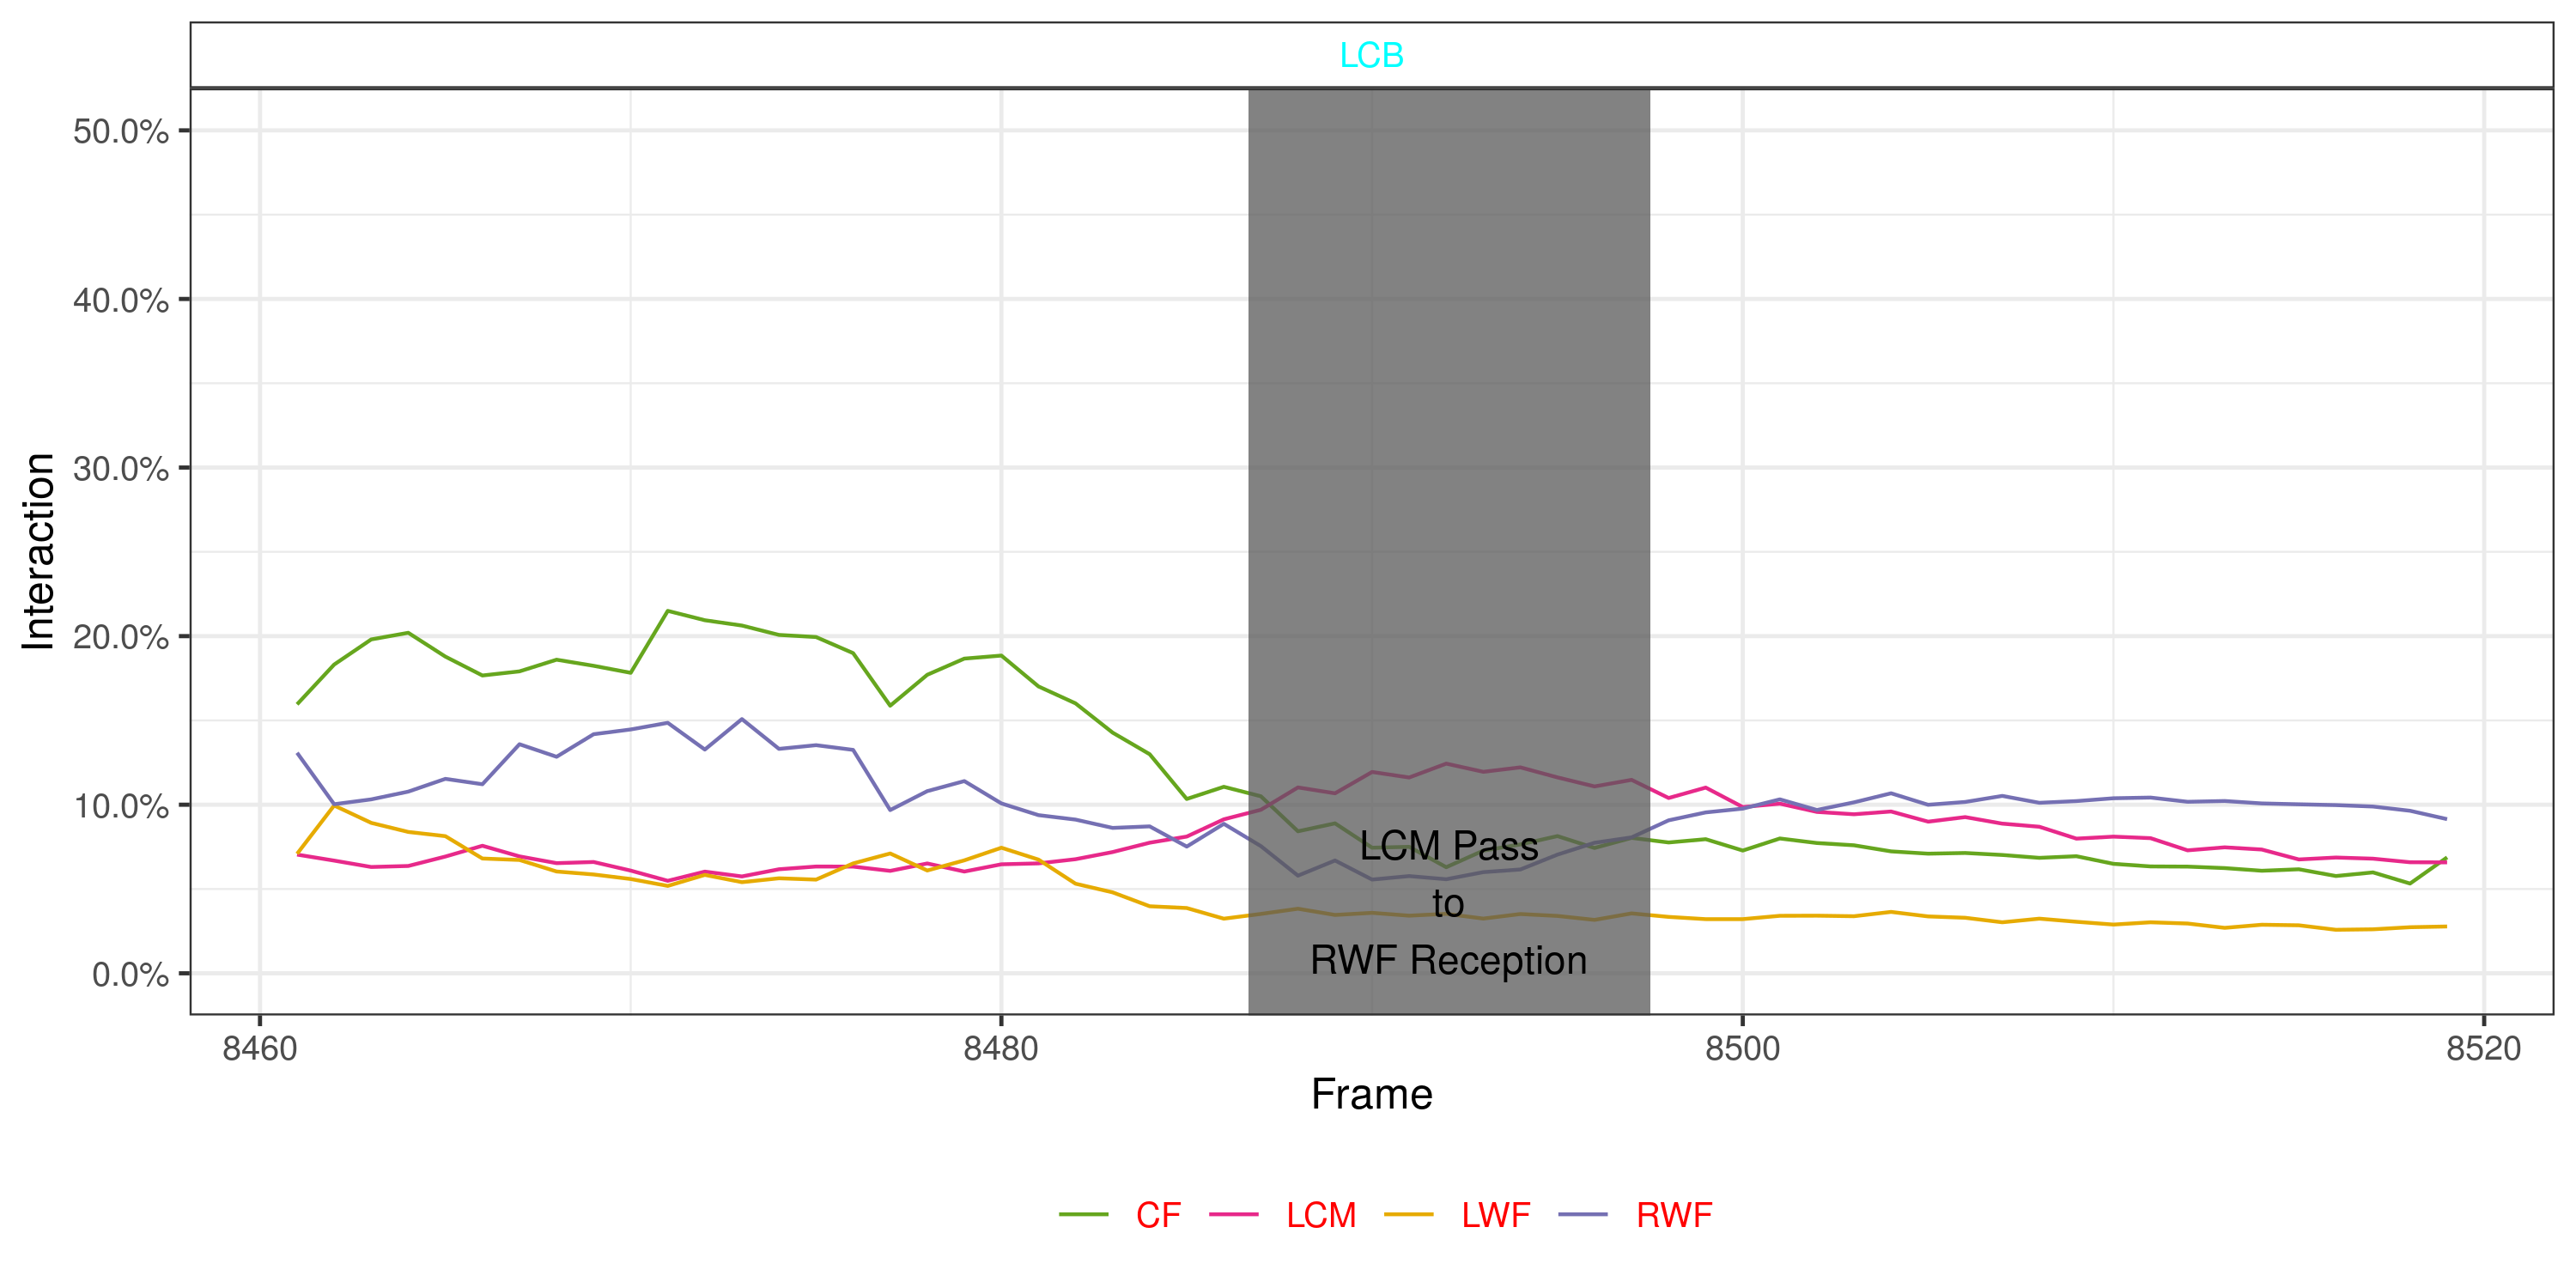
At the start of the clip, the left centre back (LCB) is marking the red team’s centre forward (CF) and partly the right wing forward (RWF). He then switches his attention to the left centre midfielder (LCM) before finally returning to mark the right wing forward again.
The figure below shows the pass prevention exerted by the blue team’s left centre back on members of the attacking team during the course of the clip. The magnitudes of the left centre back’s pass prevention on these players during the three stages of the clip match our observations as well:
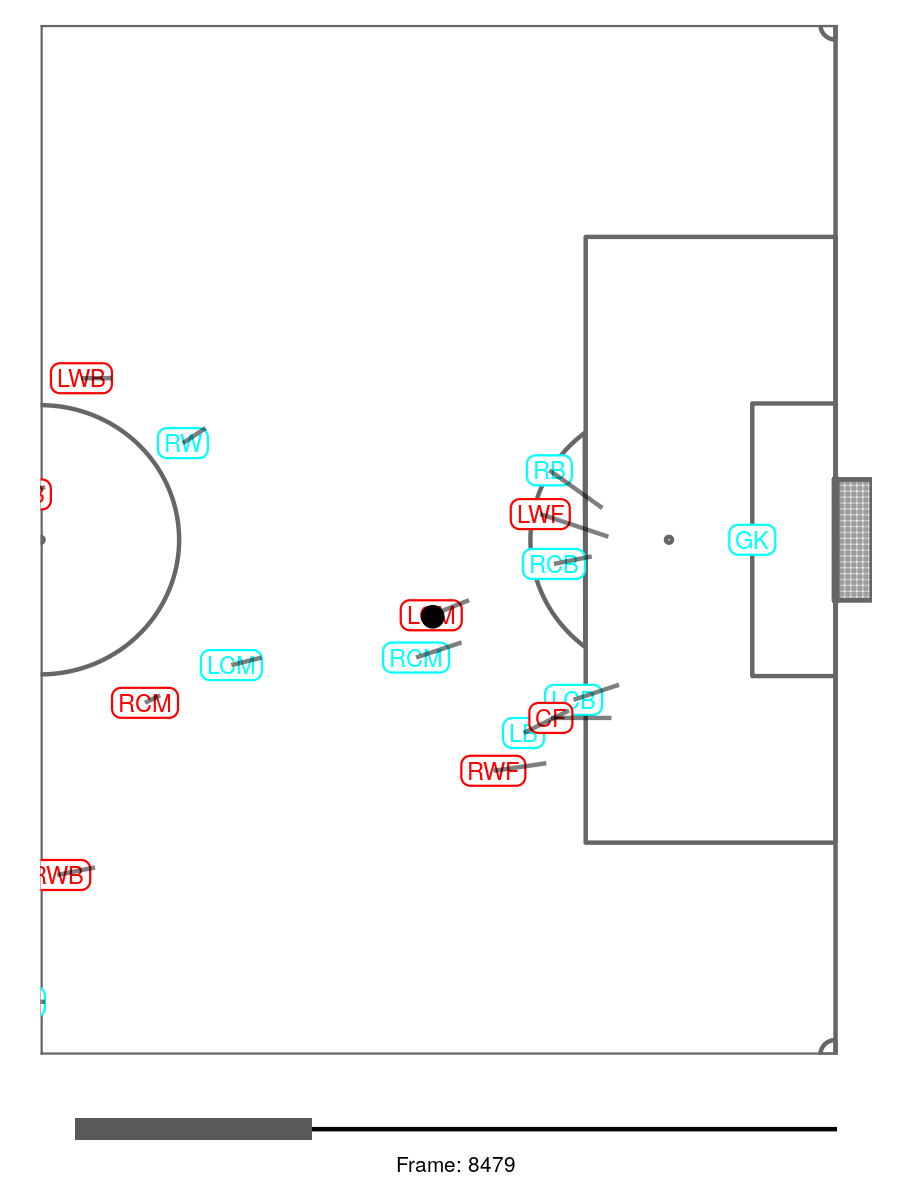
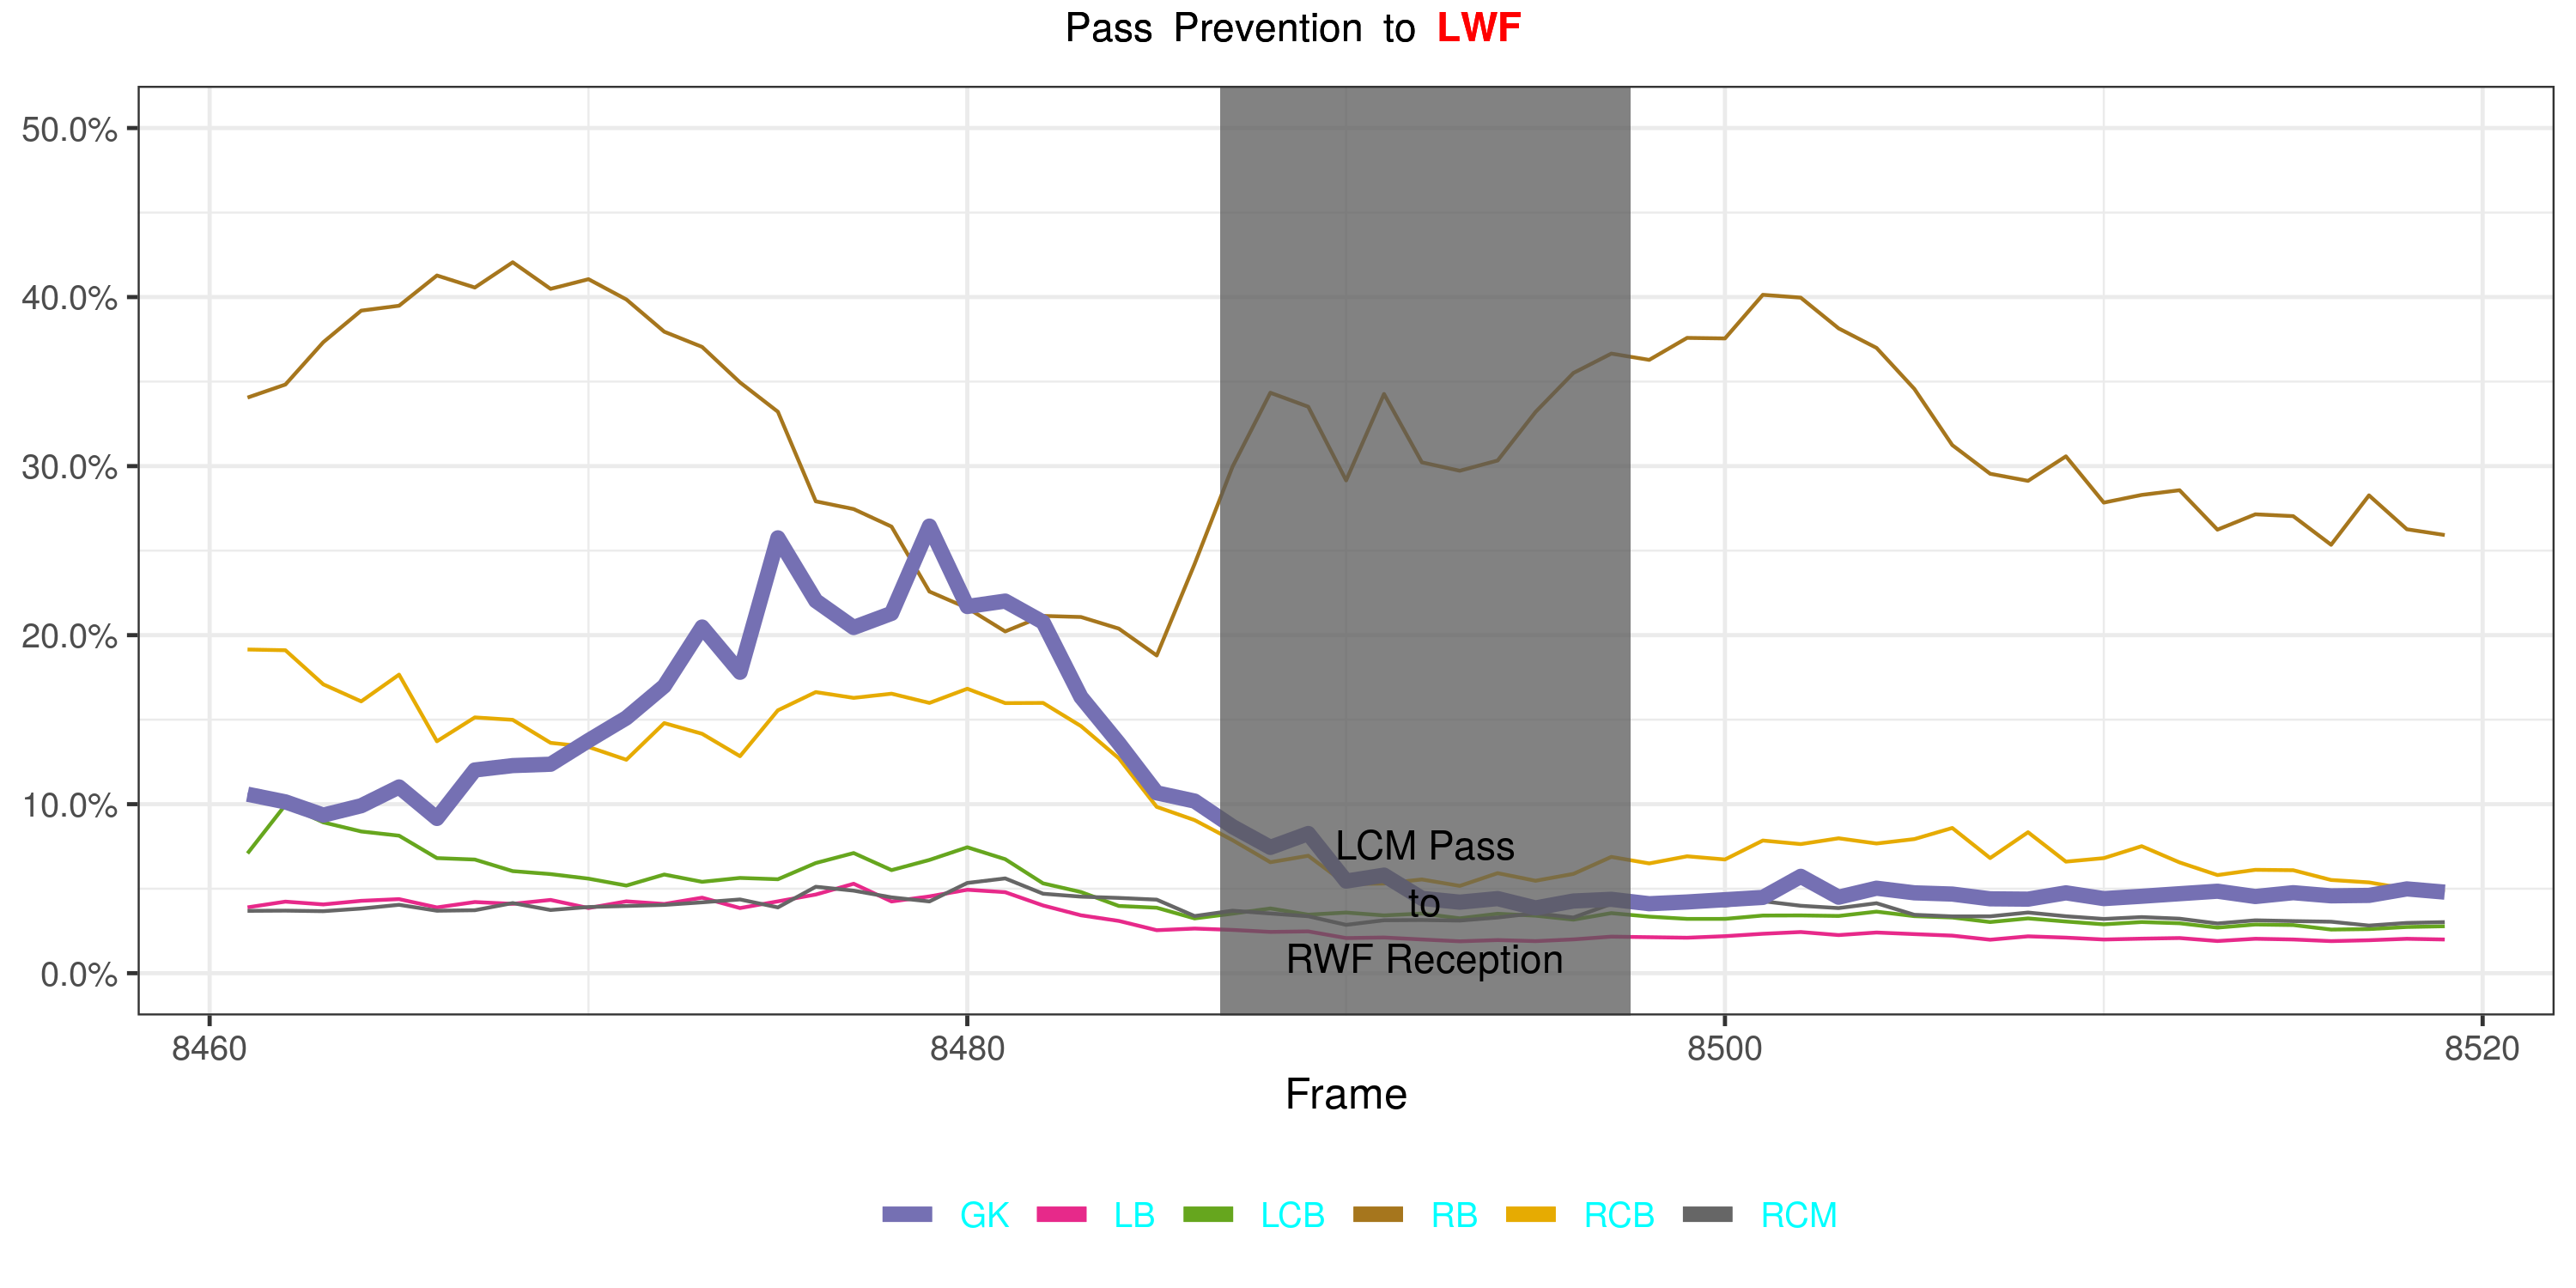
Here’s another scenario from that same clip above. Notice the role of the blue team’s goalkeeper (GK) in the play:
In the image below, you can see the pass prevention by the goalkeeper on the red team’s left wing forward (LWF) rising to a very high value. This might be a good proxy to identify situations where a player was well-placed to receive a pass which may need the keeper to come off the line and try and intercept.
Shot Prevention:
Similar to the pass prevention values over the duration of the clip, you can also generate the shot prevention values by various players as a time series:
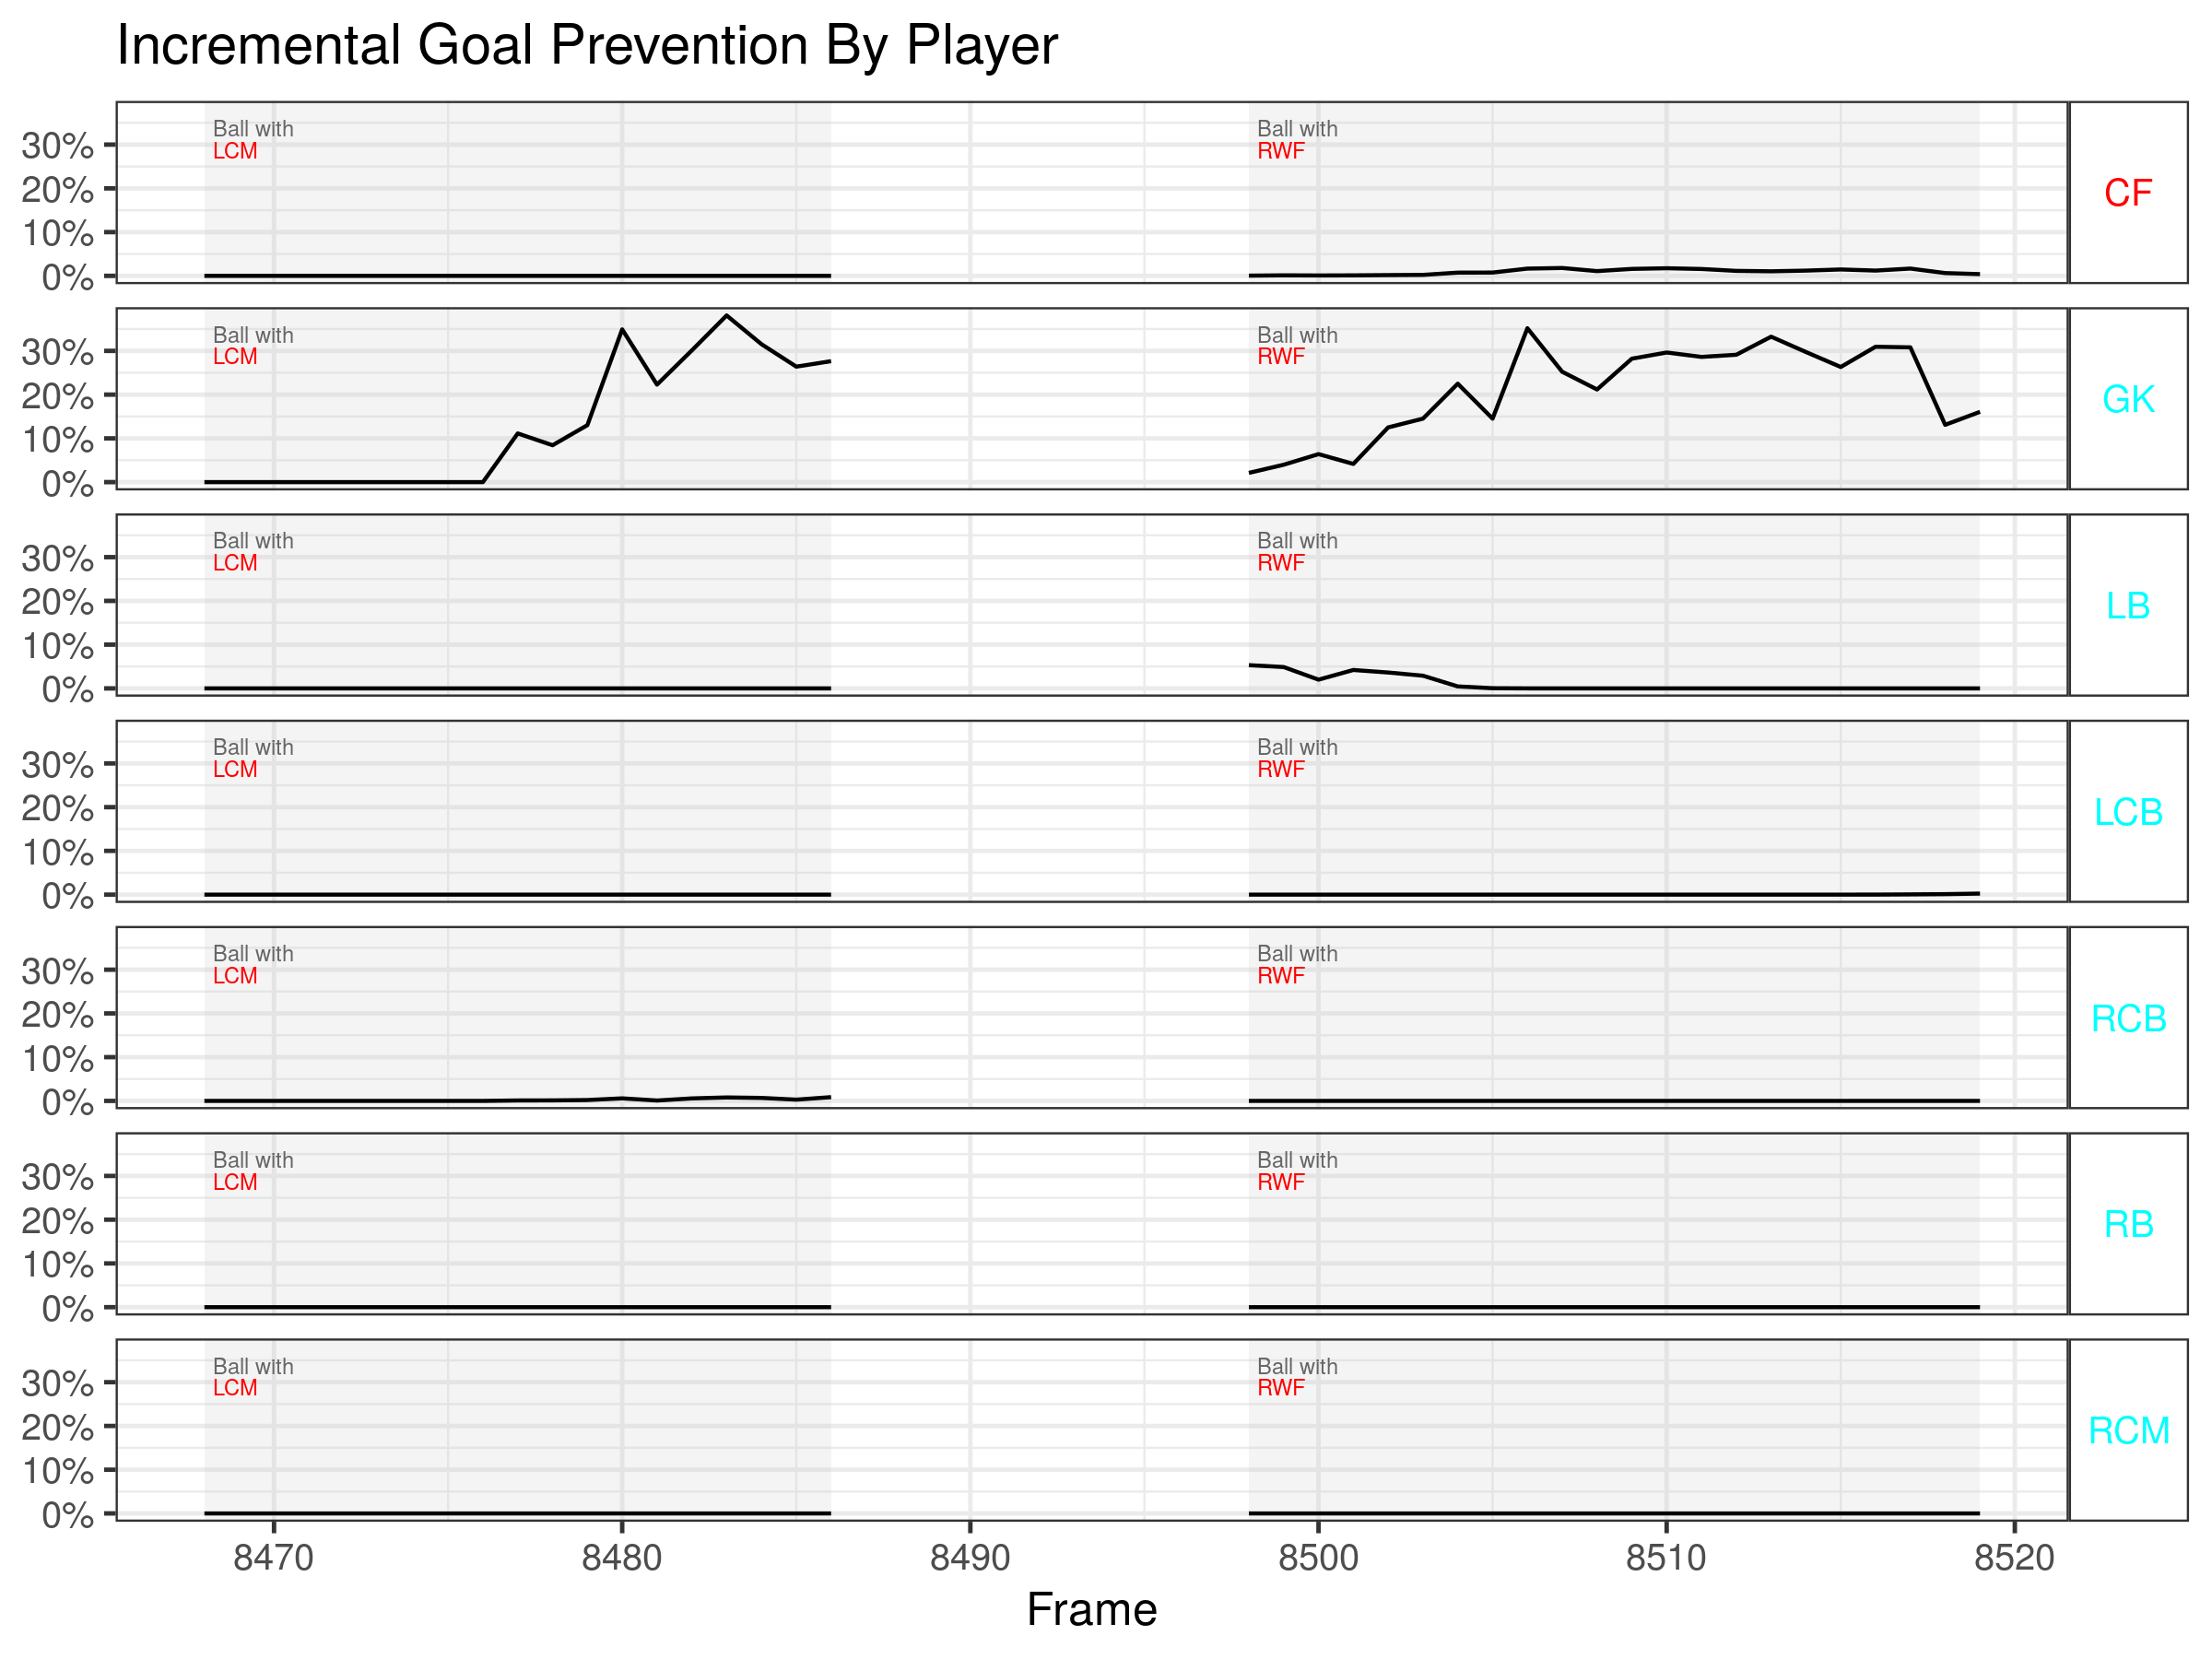
During this clip, the defending players don’t make an active attempt to block shots, choosing to mostly focus on blocking passes. This shows in their shot prevention values as well with most of the responsibility being shouldered by the goalkeeper.
The shot prevention model captures off the ball activity well which, until now, has only been possible through repeated viewing of game footage. The advantage of a computational method is that scaling it is very easy and it can calculate these numbers, give trends, point out interesting situations, and many more, helping the analyst focus their energies on going deeper into plays that are of interest to them rather than searching through lots of footage by themselves.
Industry Implications
There are many other use cases in which these models can be extended to both defensive and offensive interactions.
For example, it could also be used to:
- Identify marking responsibilities
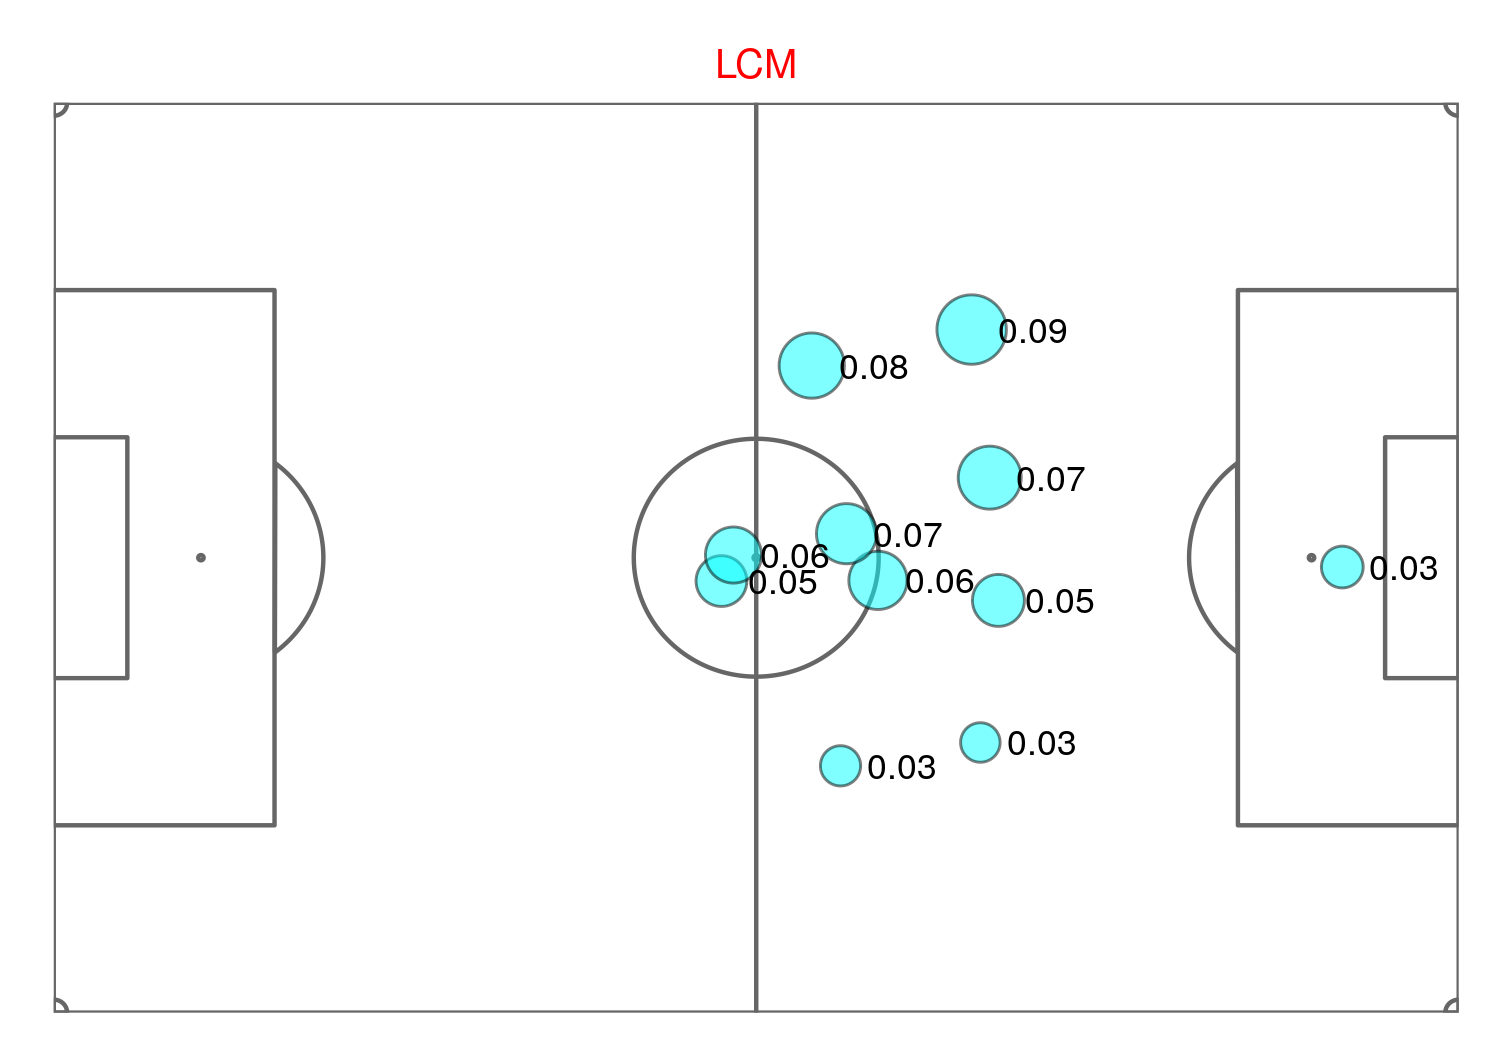
The pass prevention model can be used to assess how you might assign marking responsibilities in games.
This graphic shows the average pass prevention by each blue team player to the LCM over the first half of a match.
- Missed shooting opportunities
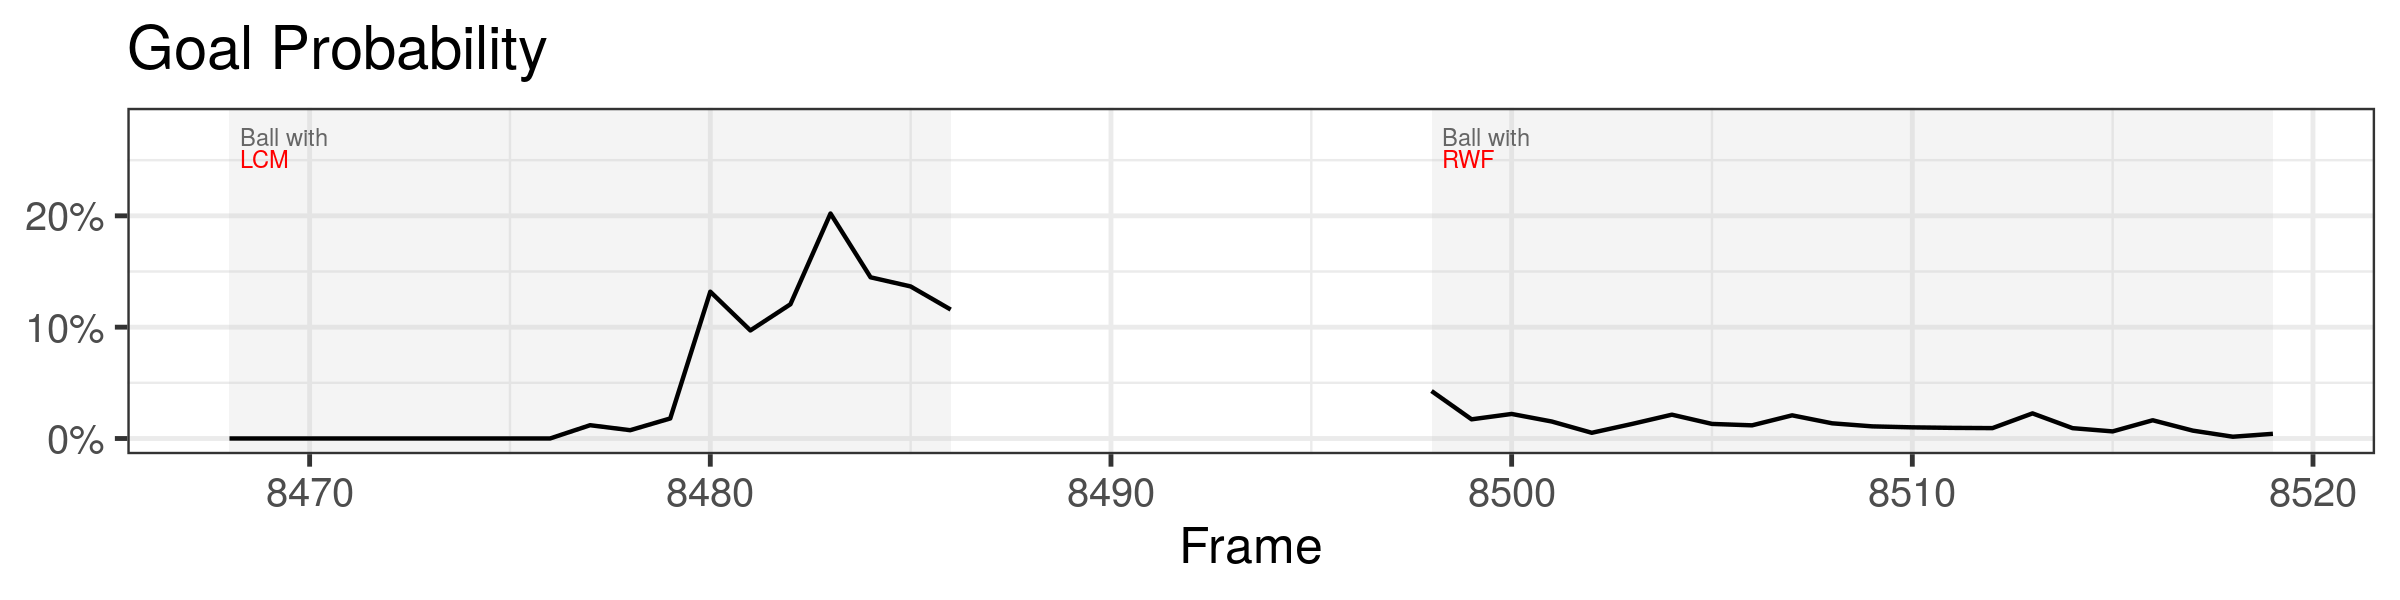
The shot prevention model could also be used to inform the decision-making abilities of players about when to attempt a shot.
In this example, the shot prevention model indicates that the left centre midfielder (LCM) had the highest probability opportunity to attempt a shot while he had the ball. He chose to hold on to the ball and pass it instead.
- How well the goal was guarded
The shot prevention model can be used to help you assess how well you are defending the goal during games.
In this example, at the moment at which scoring probability was highest—based on the blocking probability of various shooting trajectories—the far post area of the goal was well protected but the near post area was quite exposed.
To find out more about Aditya’s work, you can get in touch with him on Twitter @thecomeonman or by email at aditya.kothari@protonmail.com.
Analytics FC provides software and data services to entities within football looking to realise the gains possible from analytical thinking. We provide cutting-edge software solutions such as TransferLab, which helps improve and simplify recruitment decisions. To find out more about TransferLab and our other data services, or to find out more about us, visit our website.
Header image copyright Maciej Rogowski Photo / Shutterstock.com